Figures & data
Figure 1. The complete theoretical model of this study.
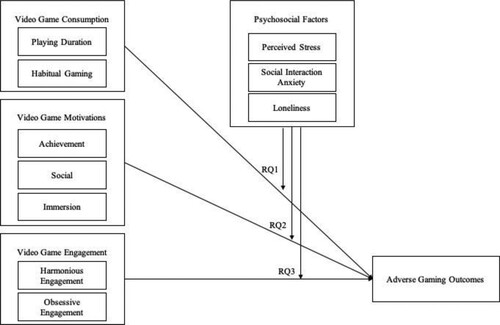
Table 1. Means, standard deviations, and zero-order correlations.
Figure 2. Adverse gaming outcomes regressed on playing duration and habitual gaming behaviour, quadratic models.
Note: Both predictors are mean-centered. Grey colour gradients show the upper and lower boundaries of the 95% confidence interval. In both cases, the y-axes are adjusted to reflect the quadratic trend.
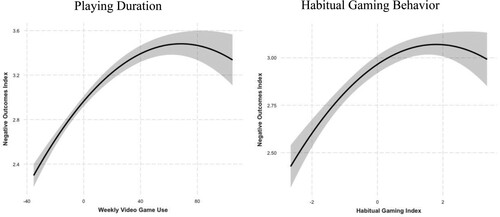
Figure 3. Adverse gaming outcomes regressed on playing duration and habitual gaming behaviour, quadratic models. Coloured lines represent simple slopes using perceived stress and social interaction anxiety as moderators.
Note: Both predictors are grand mean-centered. Colour gradients show the upper and lower boundaries of the 95% confidence interval. In both cases, the y-axes are adjusted to reflect the quadratic trend.
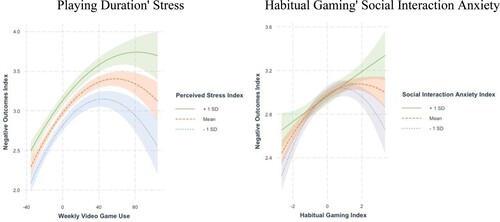
Figure 4. Johnson-Neyman plots for moderations of achievement motivation and adverse gaming outcomes by stress and immersion motivation and adverse gaming outcomes by loneliness.
Note: Grey colour gradients show the upper and lower boundaries of the beta coefficients’ 95% confidence interval. The x-axis is trimmed to the variables’ observed range.
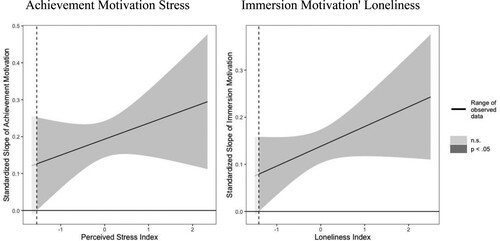
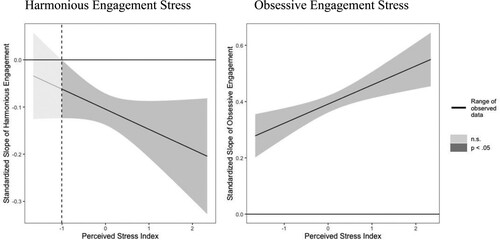
Figure 5. Johnson-Neyman plots illustrating moderations of harmonious engagement and obsessive engagement and adverse gaming outcomes by stress.
Note: Grey colour gradients show the upper and lower boundaries of the 95% confidence interval of the beta coefficients. The x-axis is trimmed to the variables’ observed range.