Figures & data
Figure 1. Re-enactment of a participant standing in front of the height-adjustable table with the inclined display on which the documents were presented.

Figure 2. Experimental user interface without highlighting-tool (left) and with highlighting-tool (right). Highlighting could be activated by tapping the highlighter-button which, in activated mode, would appear yellow. Text could then be highlighted with the finger.
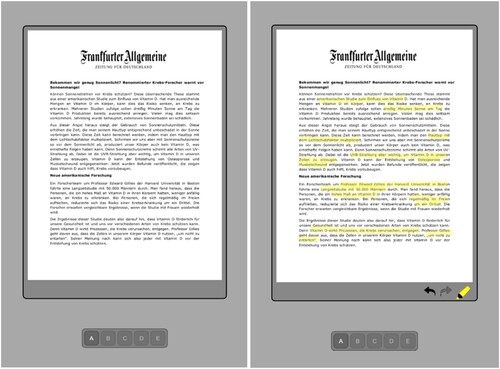
Figure 3. Items of the source-content-mapping task (translated from German). The initial order of source logos (left) and statements (right) was as shown here. Participants’ task was to drag the statements vertically such that their position matched that of the corresponding source logos. Arrows indicate the correct place assignments.
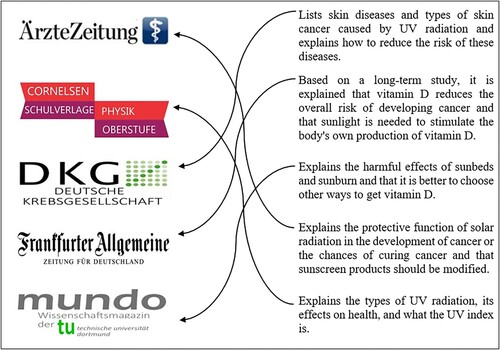
Figure 4. Heatmaps of a participant’s fixations on the document ‘Ärztezeitung’ during its first access (left; 107 sec duration), second access (middle; 28 sec duration), and re-readings (accumulated; right; 137 sec duration). Please note that the first and second accesses together account for the initial reading.
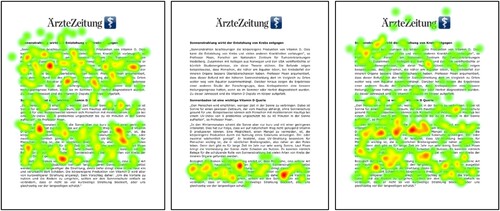
Table 1. Means (and standard deviations) for control variables as a function of text-highlighting.
Table 2. Means (and standard deviations) of the number of re-readings with the respective duration-threshold as a function of text-highlighting, as well as inferential statistics.
Table 3. Means (and standard deviations) of the number of fixations on documents per re-access for short re-accesses that lasted up to 5 sec as a function of the re-access duration and text-highlighting. The number of participants who made at least one such short re-access as well as the total number of re-accesses across participants for each time span are also provided.
Table 4. Inferential statistics for main effects of and interactions between text-highlighting and the number of re-readings (for the 1 and 3 sec re-reading thresholds) on the integrated understanding measures (number of intertextual connections and source-content mapping score).
Figure 5. Interaction between text-highlighting and the number of re-readings ≥ 3 sec (z-standardized) with regard to the number of intertextual connections.
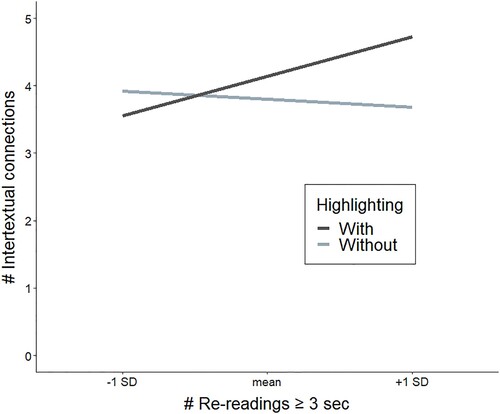
Table 5. Means (and standard deviations) for overall reading times, initial reading times (both including and excluding the time taken for highlighting during initial readings), and re-reading times as a function of text-highlighting.
Figure 6. Interaction between text-highlighting and the number of re-readings ≥ 3 sec (z-standardized) with regard to re-reading time (only re-accesses ≥ 3 sec taken into account).
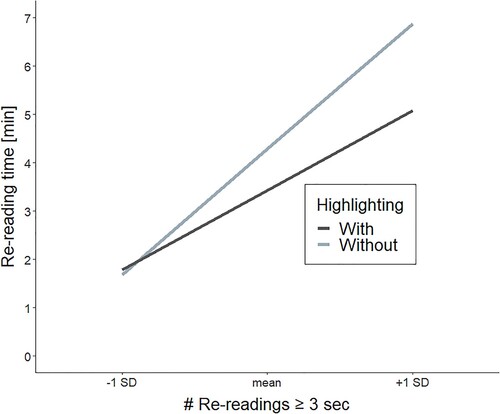
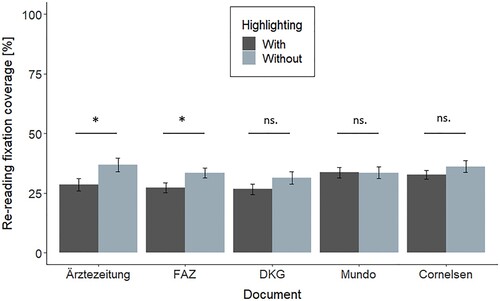
Figure 7. Mean percentage of participants’ re-reading fixation coverage for each document as a function of text-highlighting. For these analyses, only the data of participants who re-accessed the respective document are considered.