
Figures & data
Figure 1. Research model.
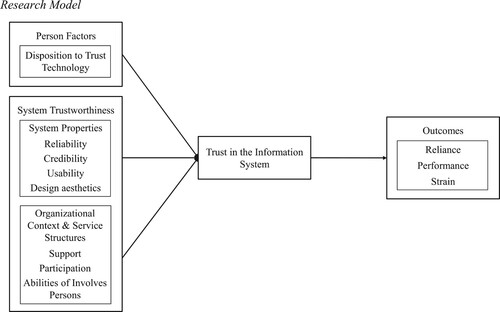
Figure 2. Flowchart of the studies’ procedures at the different time points.
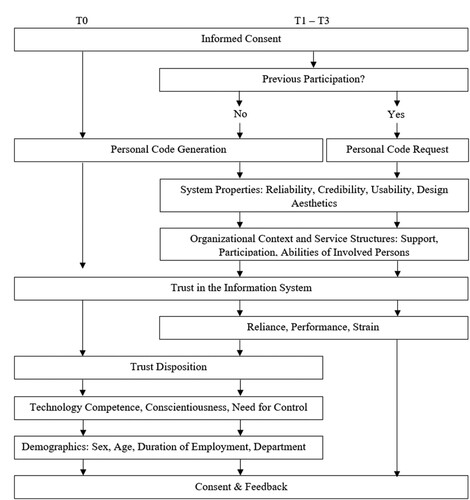
Table 1. Confirmatory factor analyses comparing the hypothesised twelve-factor model to alternative models for the first measurement point (T1).
Table 2. Confirmatory factor analyses comparing the hypothesised twelve-factor model to alternative models for the second measurement point (T2).
Table 3. Confirmatory factor analyses comparing the hypothesised twelve-factor model to alternative models for the third measurement point (T3).
Table 4. Bivariate correlations among the variables, descriptive statistics, and scale reliabilities.
Table 5. Measurement invariance tests.
Figure 3. Optimal heteroscedastic latent growth curve Amos model.
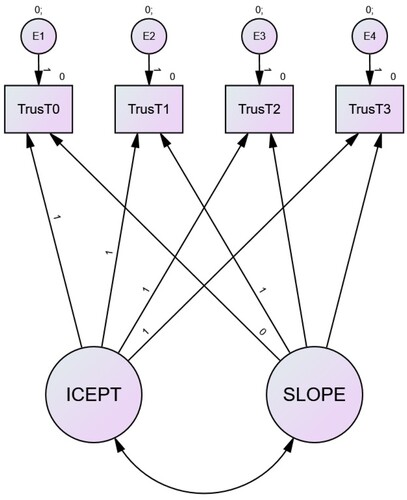
Figure 4. Mean latent growth for trust in the information system.
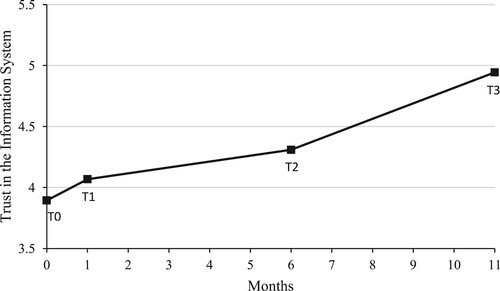
Table 6. Goodness-of-fit indices and difference tests for univariate latent growth model comparisons.
Table 7. Univariate latent growth model parameter estimates.
Figure 5. Conditional latent growth curve Amos model at T2.
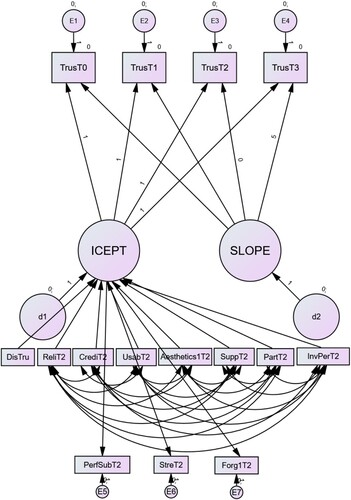
Table 8: Results from Growth Models Showing Relationships of Trust in Information Systems with Antecedents, and Outcomes at Each Time Point
Table 9. Relevance of different trust antecedents for trust in the information system at different time points.
Table A1. Intercorrelations between scale items of the first measurement point (T1).
Table A2. Intercorrelations between scale items of the second measurement point (T2).
Table A3. Intercorrelations between scale items of the third measurement point (T3).
Table A4. Construct validity measures of the scales for the first measurement point (T1).
Table A5. Construct validity measures of the scales for the second measurement point (T2).
Table A6. Construct validity measures of the scales for the third measurement point (T3).
Table A7. Discriminant validity of the scales for the first measurement point (T1).
Table A8. Discriminant validity of the scales for the second measurement point (T2).
Table A9. Discriminant validity of the scales for the third measurement point (T3).
Data availability statement
Anonymised data are available upon request from the corresponding author.