
Figures & data
Table 1. Demographic profile of the total sample and digitally excluded respondents.
Figure 1. Frequency distribution of respondents who self-reported ‘no digital access’.
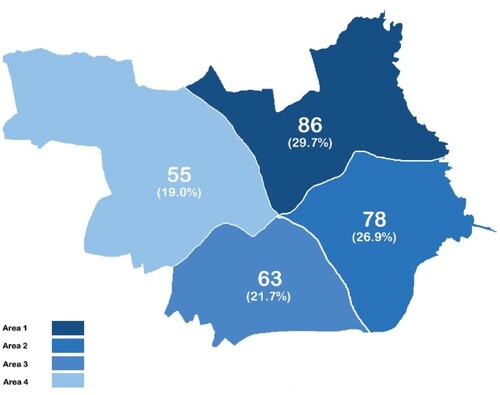
Figure 2. Frequency distribution of respondents who self-reported ‘no digital use’.
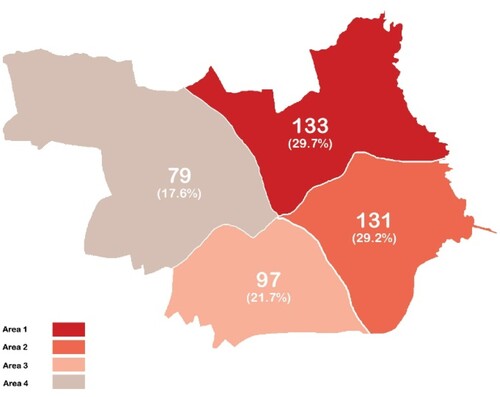
Figure 3. Frequency distribution of respondents who self-reported ‘no confidence in using digital tools’.
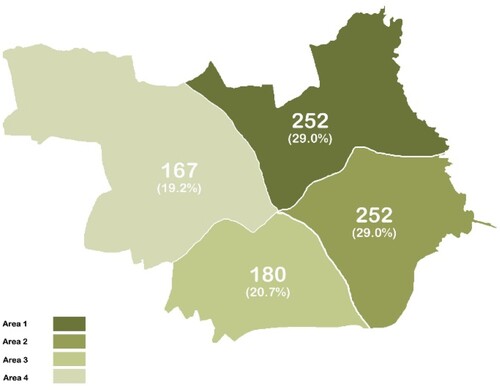
Figure 4. Frequency distribution of respondents who self-reported ‘very poor digital skills’.
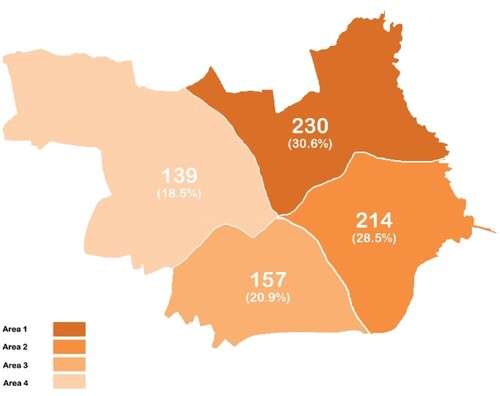
Table 2. Logistic regression models developed to understand the key determinants of being digitally excluded in the borough.
Table 3. Characteristics of the focus groups.