
Figures & data
Table 1. The independent variables for data analysis.
Figure 1. Distribution of in-degree and out-degree of blogs. (a) The distribution of the number of followees (out-degree) per account and (b) The distribution of the number of followers (in-degree) per account.
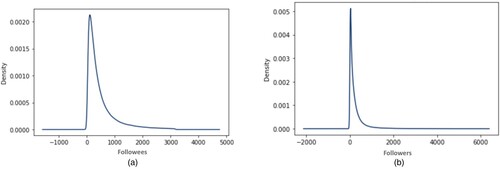
Figure 2. Distribution of creation year and deleted posts. (a) Distribution of creation year and (b) Distribution of deleted posts.
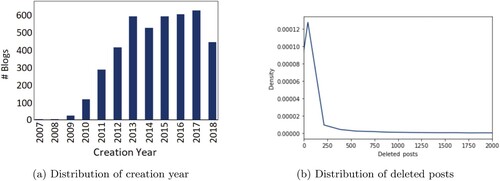
Table 2. Proportion of deleted accounts in different levels of activity.
Table 3. Logistic regression models for account deletion.
Figure 3. The four segments, each with its centroid value of the five variables. The ‘never followed’ users are not presented because they do not have centroid values.
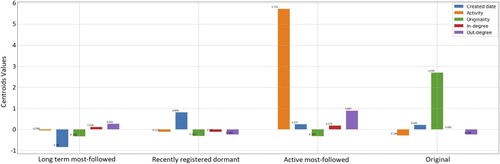
Table 4. The contingency of the number of blog deleters categorised by segment, along with the results of post-hoc hypothesis tests.
Table 5. Logistic regression models for each cluster.
Figure A1. A screenshot of the user interface on Tumblr for account deletion. The interface is displayed to users after clicking the settings page's ‘Delete Account’ link. The UI asks them to authenticate to complete the permanent account deletion process, click the ‘Nevermind’ link, or click the browser's ‘back’ button to cancel.
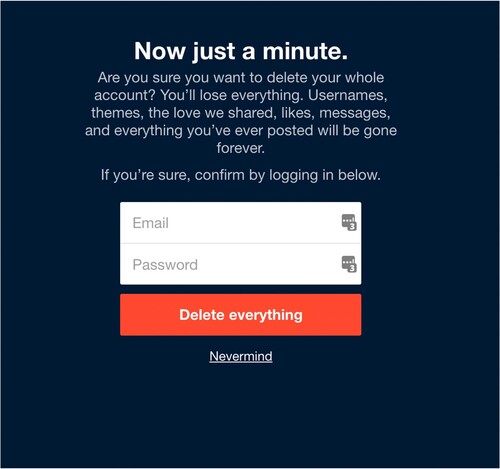
Figure A2. Distribution of deleted followees and deleted followers. (a) The distribution of the number of deleted followees and (b) The distribution of the number of deleted followers
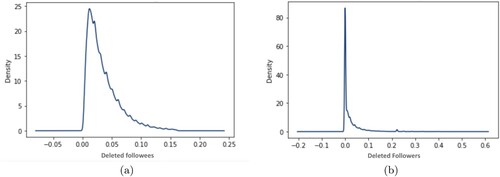
Figure A3. The distribution of social reactiveness.
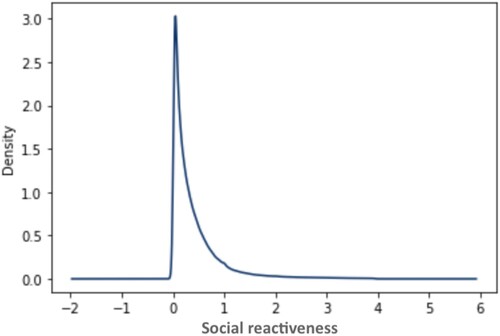
Figure A4. The Sum of Squares Error (SSE) is plotted against the number of clusters.
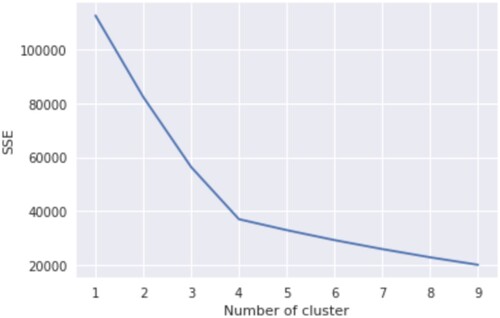
Figure A5. Distribution of users' originality and NSFW Flag. (a) The distribution of the users' originality: the proportion of original content and (b) NSFW Flag distribution. 1 -- blogs with adult content, 0- blogs without adult content.
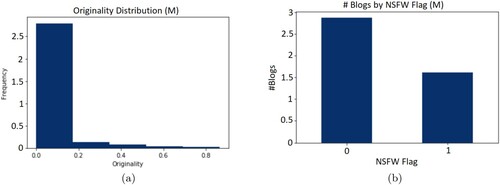
Table A1. Feature stability over the four-month study period, which presents the mean and variability of each feature.
Table A2. The goodness of fit for the logistic regression models by segments was evaluated using a deviance test between each model and the 0-Model.
Table A3. Clusters centroid values and interpretation.