
Figures & data
Table 1. Available measures accessing the connection between the user and their avatar.
Table 2. Socio-Demographics of the sample.
Table 3. The User-Avatar Discrepancy Scale (UADS) with all items, prior to the analyses conducted.
Table 4. Fit Indices, Factor Loadings, and Reliabilities of the EFA in the Calibration Sample.
Table 5. The factor loadings and reliabilities of the one-factor EFA in the calibration sample.
Table 6. Fit indices, factor loadings, and reliabilities of the one-factor CFA in the validation sample.
Table 7. User Avatar Discrepancy questionnaire item fit data.
Table 8. User Avatar Discrepancy questionnaire item discrimination (α) and difficulty (β) parameters.
Figure 1. The user-avatar discrepancy category characteristic curve. The figure is expressed in a nonlinear regression line relating to discrimination (α) and difficulty (β) parameters. Discrimination (α) describes how well an item can differentiate between participants according to their latent trait levels. Thus, items more strongly related to the latent variable present steeper slopes. β reflects the level of the latent trait, theta (θ), at which a participant has an equal probability (50:50) of endorsing an item. For example, ‘easier’ items have lower β values and are presented closer to the horizontal axis.
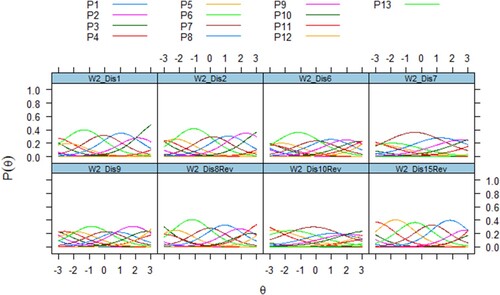
Figure 2. The user-avatar discrepancy item information curve. Information refers to the ability of an item to accurately estimate scores on the theta (θ). Item-level information demonstrates how well each item contributes to scoring estimation precision, with higher levels of information indicating more accurate score estimates.
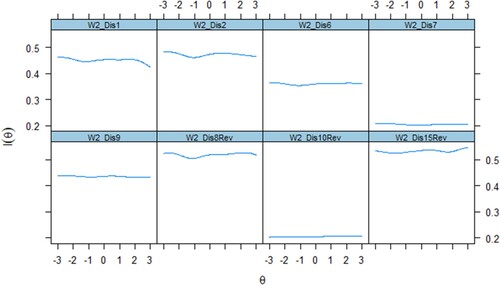
Figure 3. The Test Characteristic Curve (TCC) provides a visual representation of expected discrepancy scores (blue line) as a function of the latent trait. The figure demonstrates that the latent trait (i.e. the discrepancy) increases steeply, as the total score reported increases and becomes positive.
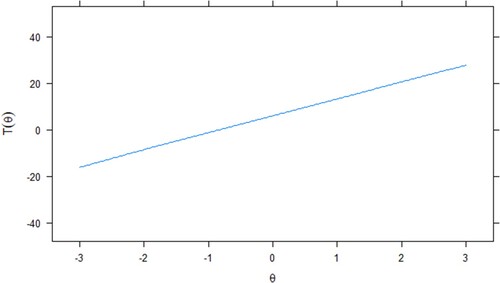
Figure 4. The Test Information Function (TIF) curve demonstrates the relationship between the stand errors (SE; dotted line) and reliability indices. The blue line represents the level of scale information for varying levels of the latent trait and the red line is the level of error for similarly varying levels of the latent trait.
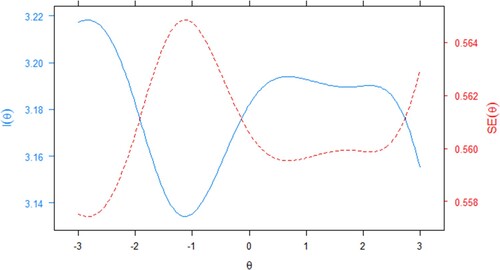
Table 9. Correlation matrix of the UADS items with the AEQ Addiction and Engagement factors.
SupplementaryFileFinal.docx
Download MS Word (272.3 KB)Data availability statement
All data and syntax have been made publicly available at Git Hub and can be accessed at https://vas08011980.github.io/UABDISSCALE/UserAvatarBondDiscrepancyQuestionnaireFile.html.