
Figures & data
Figure 1. (a) Schematic diagram of the experimental facility, (b) Top view of the test section (TS3). Dimensions in mm.
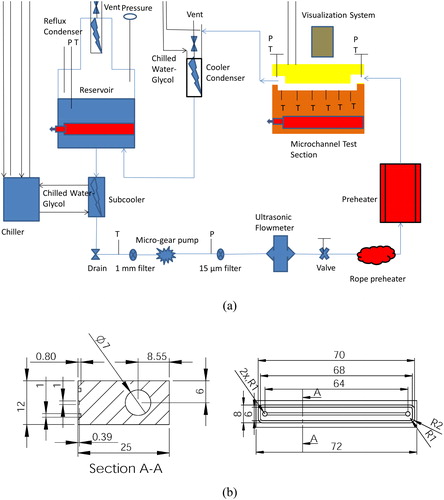
Table 1. Dimensions of the microchannels in the current study.
Figure 2. Three-dimensional model of the test section.
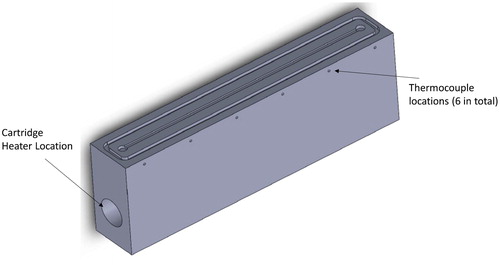
Figure 3. Single-phase validation of experimental procedure and measurements.
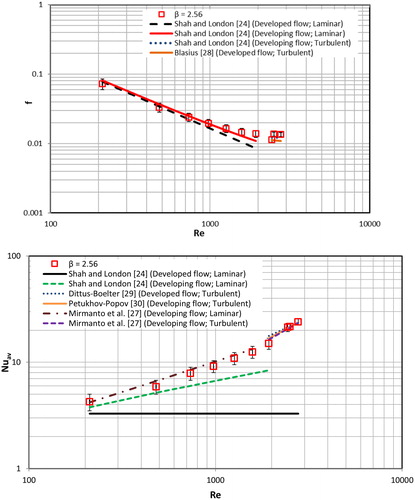
Table 2. Single-phase pressure drop and heat transfer correlations, range and MAE reported by the corresponding authors based on their data.
Figure 4. Definition of the observed flow patterns in the current study. (a) Bubbly flow, (b) Slug flow, (c) Churn flow, and (d) Annular flow.
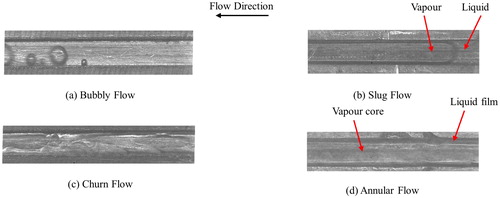
Figure 5. Fluctuations in fluid inlet and outlet temperature and pressure drop at G = 400 kg/(m2s) for TS2: (a) single phase flow with q” = 0 kW/m2, (b) During periodic flow, q” = 99.1 kW/m2.
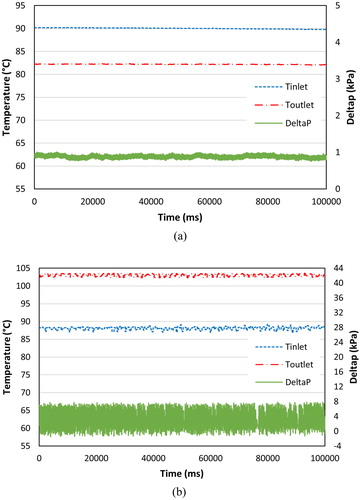
Figure 6. Sequence of flow images at the middle of the channel for periodic flow regime in the microchannel TS2 (β = 2.56) at q” = 99.15 kW/m2 and G = 400 kg/(m2s).
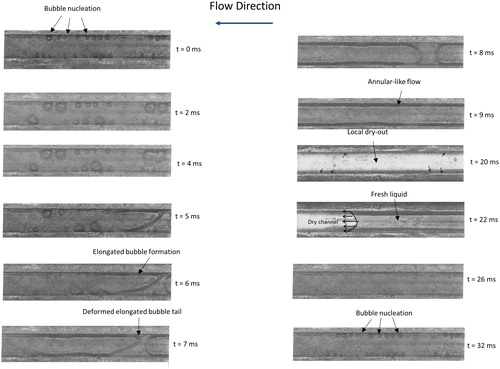
Table 3. The ratio of the evaporation momentum force and the inertia force for TS2 at boiling incipience.
Figure 7. Effect of channel aspect ratio on bubbly flow.
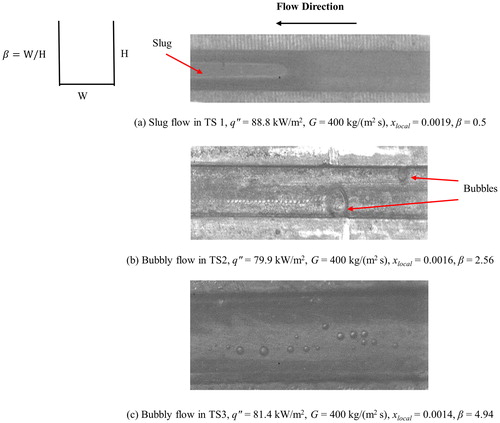
Figure 8. Effect of channel aspect ratio on slug flow.
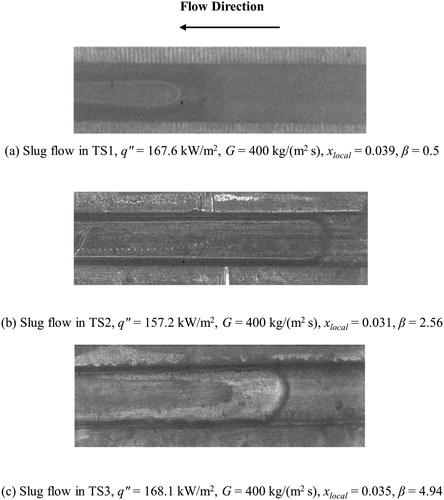
Figure 9. Effect of channel aspect ratio on churn flow.
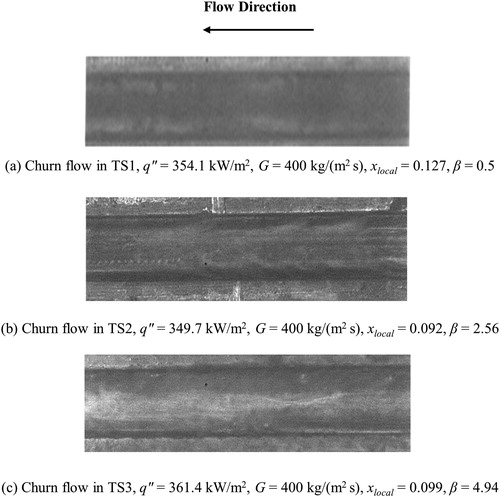
Figure 10. Effect of channel aspect ratio on annular flow.
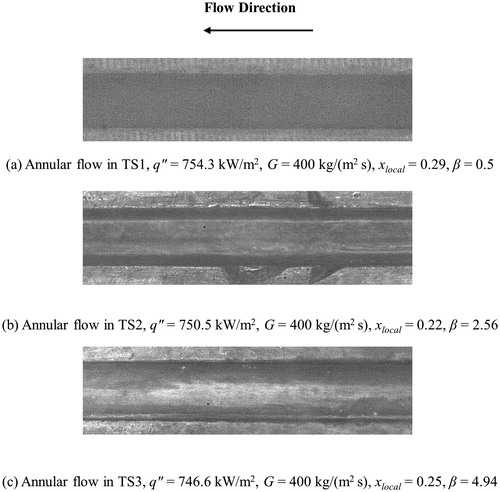
Figure 11. Boiling curve for TS1 (β = 0.5) at z/L = 0.6.
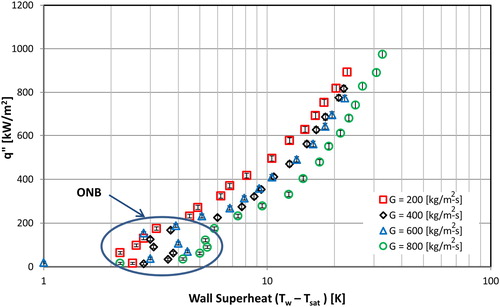
Figure 12. Wall and saturation temperature versus dimensionless axial distance for (a) G = 200 kg/(m2s) and (b) G = 800 kg/(m2s).
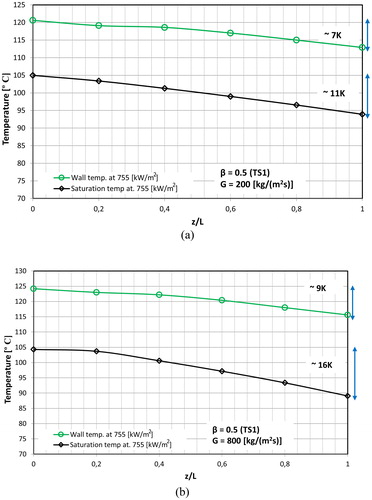
Figure 13. Effect of aspect ratio on boiling curve for G = 800 kg/(m2s) at z/L = 0.6.
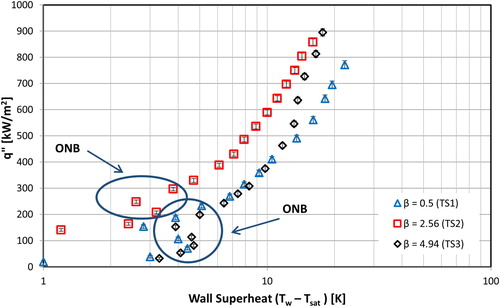
Figure 14. Effect of low and moderate heat flux input and local quality on the local heat transfer coefficient at 200 kg/(m2s) for TS1.
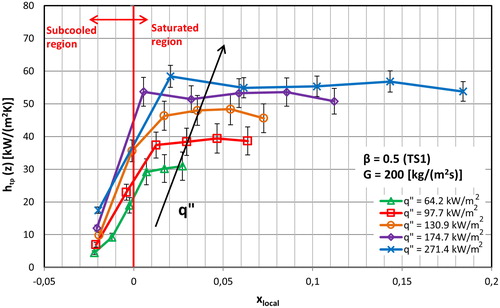
Figure 15. Effect of high heat flux input on the local heat transfer coefficient for the TS1 at 200 kg/(m2s); (a) versus local vapor quality and (b) versus axial distance.
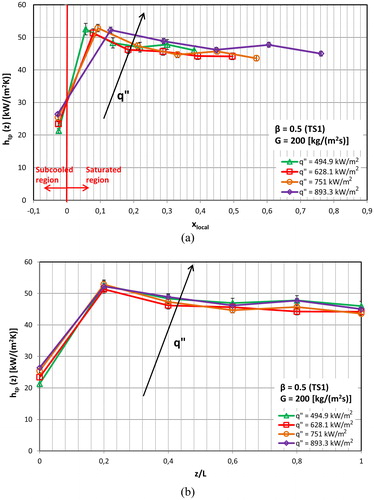
Figure 16. Saturation temperature variation (24 K) and wall temperature variation (12 K) along the channel axial distance for the TS1 at 800 kg/(m2s) at two different heat fluxes.
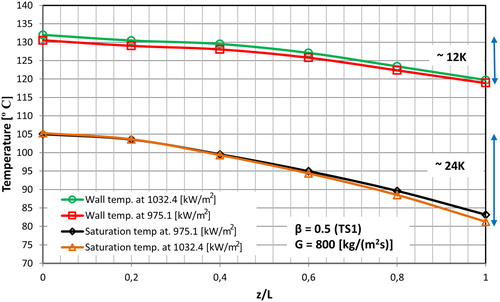
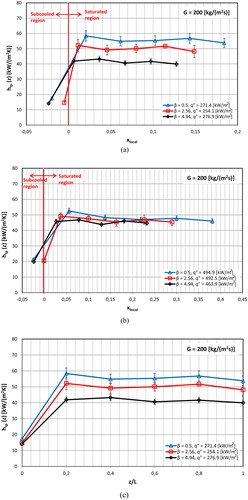
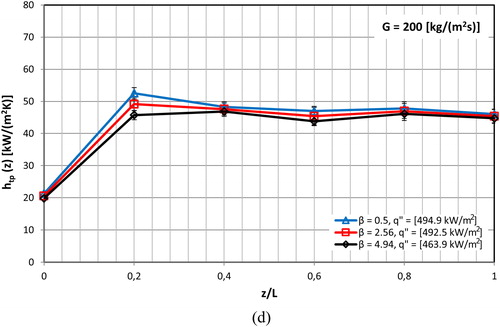
Figure 18. Effect of aspect ratio and heat flux on the average heat transfer coefficient for the three test sections; (a) at G = 200 (kg/m2s) and (b) at G = 600 (kg/m2s).
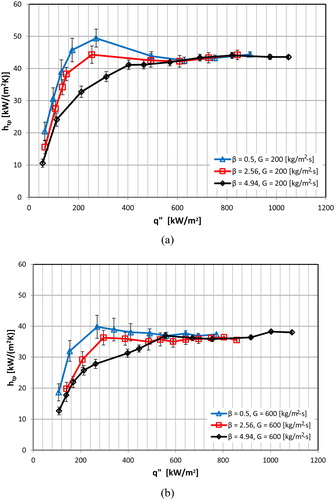
Table 4. MAE and the percentage of data within ± 30% error bands for conventional scale correlations.
Table 5. MAE and the percentage of data within ± 30% error bands for micro-scale correlations.
Table 6. Conventional-scale and micro-scale boiling heat transfer correlations, range and MAE reported by the corresponding authors based on their data.