Figures & data
Table 1. List of references about different PCHE channels.
Figure 1. Thermal-physical properties of methane at different pressures.
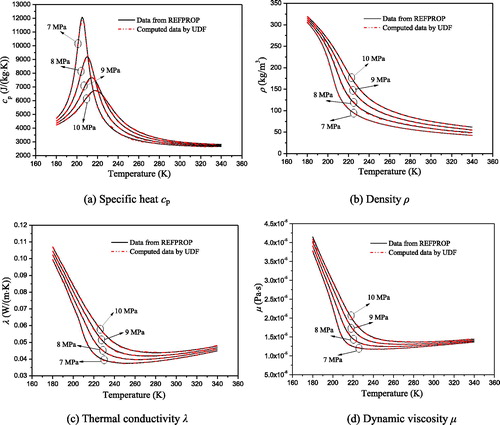
Table 2. Composition of LNG [Citation32].
Figure 2. Schematic diagram of the physical model.
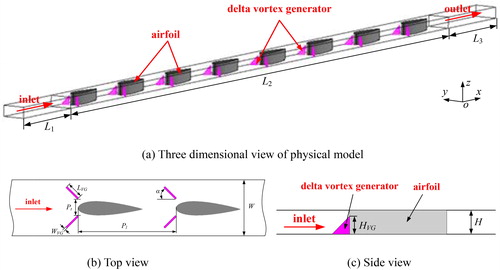
Figure 3. Schematic diagram of the airfoil.
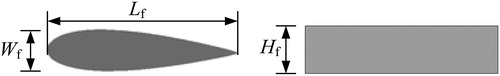
Table 3. List of different PCHE configurations.
Table 4. Geometric parameters of different PCHE configurations.
Table 5. Expressions for ϕ, Γϕ, and Sϕ.
Figure 4. Boundary conditions for computational model.
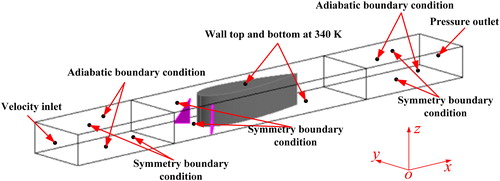
Figure 5. Selected grid system.
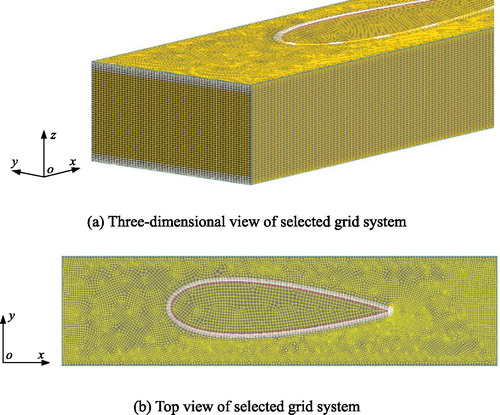
Table 6. Variation of grid independence (uin=8.0 m/s).
Figure 6. and f-factor comparisons between simulated and experimental results.
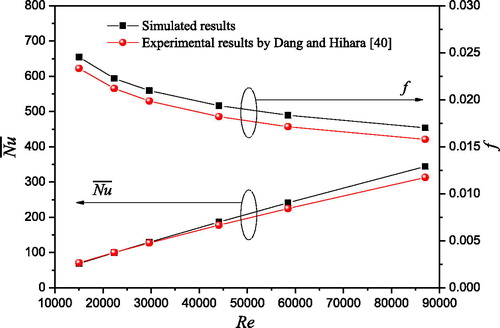
Table 7. Working conditions for different cases.
Figure 7. Comparisons of cp for Case B at different pressures.
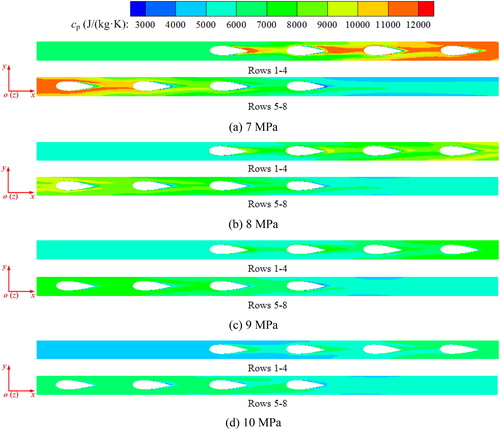
Figure 8. Comparisons of ρ for Case B at different pressures.
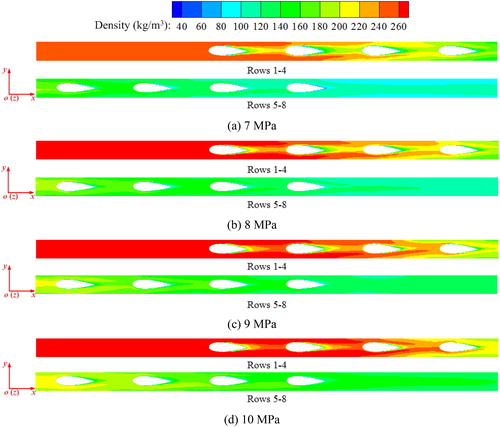
Figure 9. Local Nusselt number NuL and cp along the main flow direction at uin=2.0 m/s.
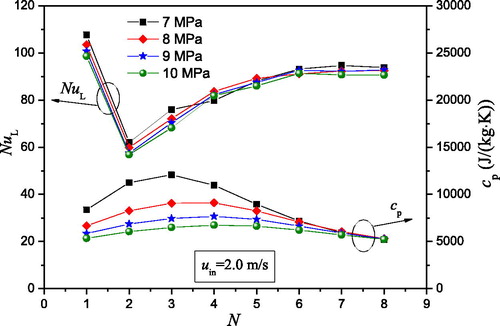
Figure 10. and f-factor comparisons for Case B at different pressures.
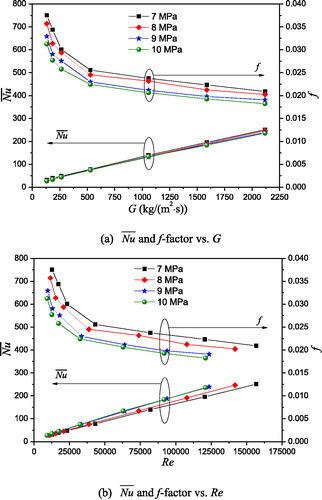
Figure 11. Heat transfer performance comparisons for different PCHEs.
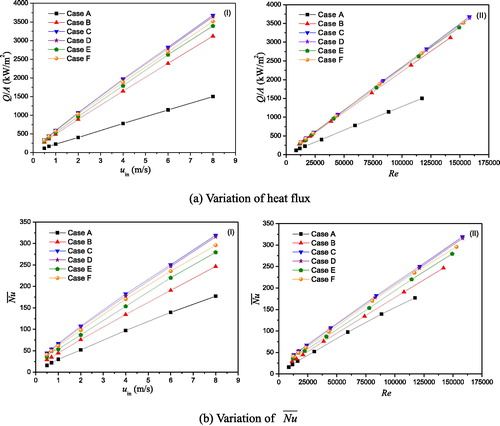
Figure 12. Streamlines at the central cross section in the z-direction of Case B at uin = 2.0 m/s.
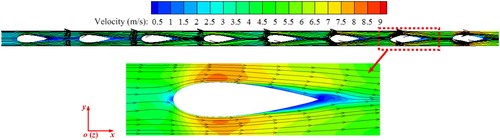
Figure 13. Streamlines in the 7th row of Cases C–F at uin = 2.0 m/s.
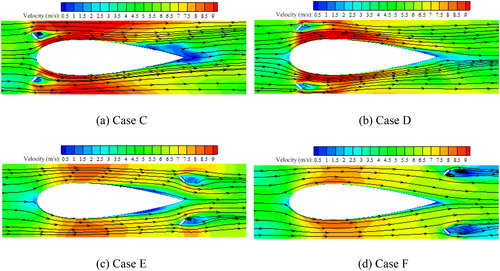
Figure 14. Local Nusselt number NuL in the 7th row at uin=2.0 m/s.
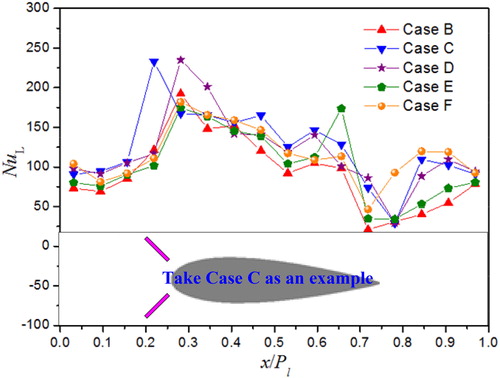
Figure 15. Velocity distributions at the different cross-sections at uin=2.0 m/s.
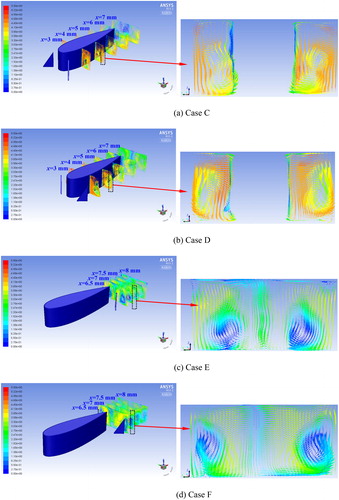
Figure 16. Friction factor performance comparisons for different PCHE configurations.
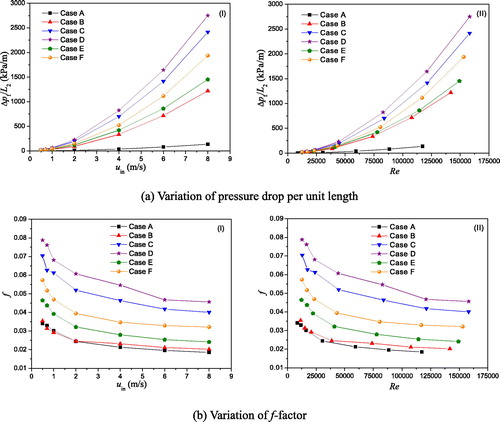
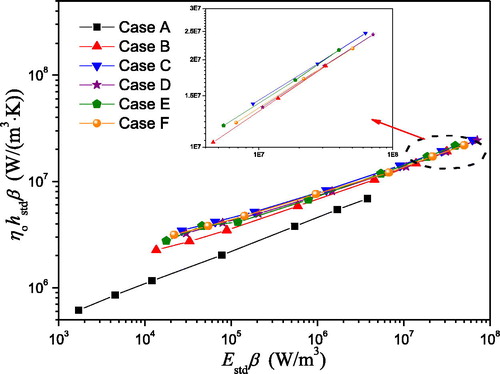
Figure 17. Volume goodness comparisons for different PCHE configurations.