
Figures & data
Table 1. Percentage of identical distribution of samples into the active/passive training sets, calibration set, and validation set.
Figure 1. The general scheme of building up quasi-SMILES.
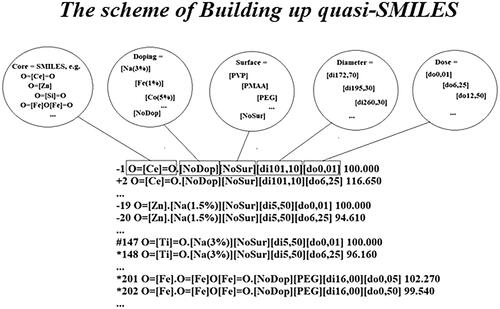
Figure 2. The graphical representation of the model was obtained for split #1 by the CORAL program interface. Red and green colors show the statistical characteristics of hidden correlations for active and passive training sets.
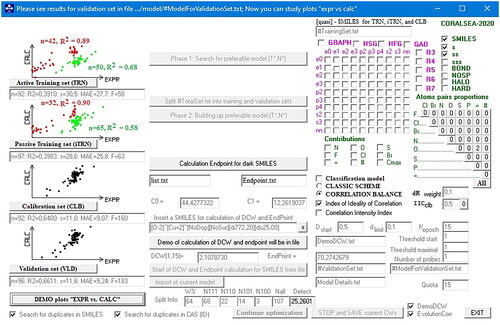
Table 2. The statistical quality of models for splits #1–#5 observed in the cases of the Monte Carlo optimization with different target functions calculated with EquationEquation (4)(4)
(4) and EquationEquation (5)
(5)
(5) .
Table 3. Fragments of quasi-SMILES are promoters of increase/decrease inhibition of human lung carcinoma cell line A549.
Table 4. The statistical characteristics of the models for the lists of quasi-SMILES that were unknown when developing the corresponding model (i.e., quasi-SMILES which are absent in the active training, passive training, and calibration sets used to develop corresponding models).
Supplemental Material
Download PDF (651.9 KB)Data availability statement
The data used in this work and developed models are freely available Supplementary materials section.