Figures & data
Table 1. Descriptive statistics for all variables used in the analyses.
Table 2. Results from ordinal and binary logistic regressions of LGBT unwelcomeness and personal mistreatment in sports.
Table 3. Results from logistic regressions of playing sports regularly and spectatorship, in the past 12 months.
Table 4. Results from OLS regressions of frequency talking about sports with others, in the past 12 months.
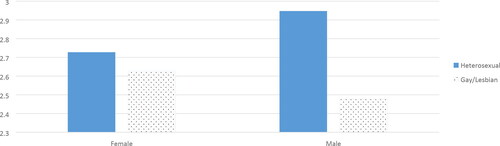
Figure 1. Interaction between sexuality and gender in adults' probability of sports spectatorship.
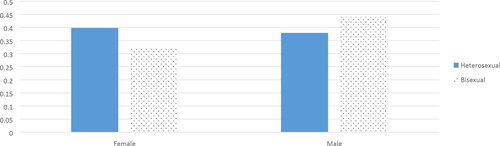
Figure 2. Interaction between sexuality and gender in adults' frequency of talking about sports with others.