
Figures & data
Figure 1. The conceptual framework.
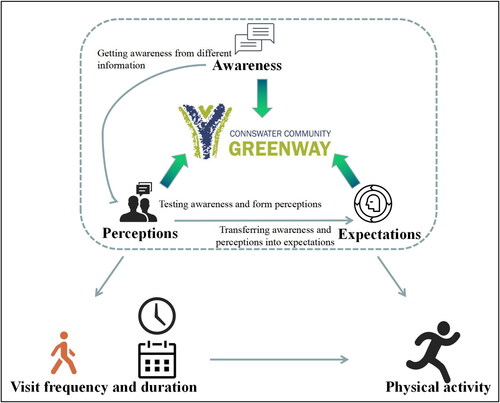
Figure 2. CCG (a) before and (b) after the regeneration project.
Source: The Connswater Community Greenway Trust, EastSide Partnership, 2022.
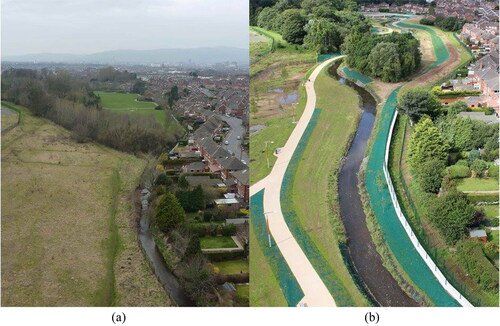
Table 1. Descriptive statistics of PARC samples.
Table 2. Multilevel model results of associations of information, perceptions, and expectations and perceptions of the CCG and frequency and duration of CCG visits.
Table 3. Multilevel model results of associations of information, perceptions, and expectations of the CCG; CCG visit frequency and duration; and PA.
Supplemental material
