Figures & data
Figure 1. The Geomari catamaran at the start of the campaign and the daily trajectory lines: Monday (red), Tuesday (orange), Wednesday (black), Thursday (green) and Friday (blue). Blue dots are the gravity data already existing within the Finnish borders.
Source: Author
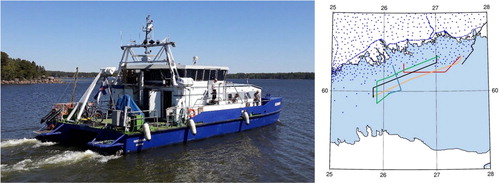
Figure 2. Relations between the different heights and surfaces. Geoid_0 is the geopotential surface of a geoid when it is not fitted to a national height system. Geoid_N2000 is the geopotential surface of a geoid aligned to the N2000 height system. is the offset between the aligned and non-aligned geoid models and
is the sea level measured by a tide gauge in the N2000 height system.
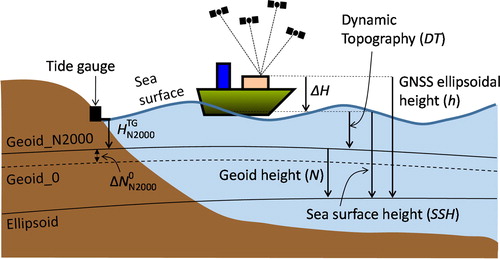
Figure 3. Reference stations (green circles) and the estimated stations (black dots).
Source: Author
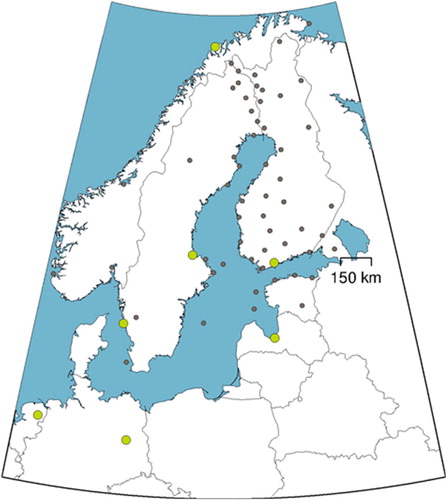
Figure 4. The tide gauges (stars) from Finland and Estonia that were used to model the DT in the Gulf of Finland.
Source: Author
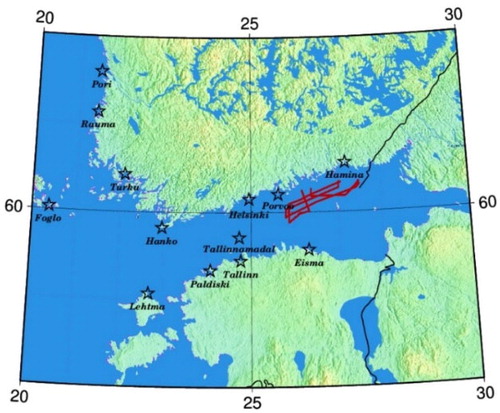
Figure 5. An example of the steps in the process from the original PM surface (top left) to the corrected PM surface (bottom left). The original PM is not aligned to a geodetic height reference and is corrected with a correction surface (top right), calculated from the differences to the tide gauge surface (bottom right). Black dots are the tide gauges.
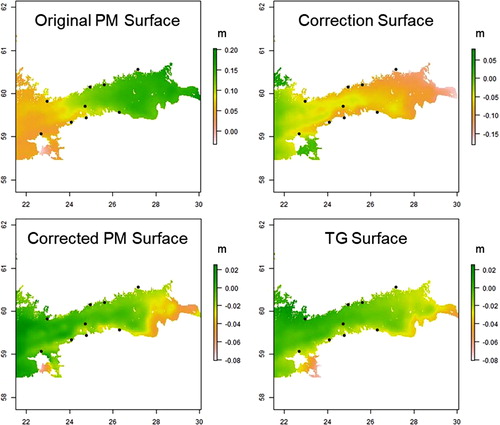
Table 1. Statistics of the differences between geoid heights derived from the Geomari GNSS observations and geoid heights from the geoid models FIN2005N00, NKG2015, FIN_EIGEN-6C4 and FIN_EIGEN-6C4_GEO, with DT corrections from the TG (left) and PM (right).
Table 2. Statistics of the differences, after the removal of the average of the whole campaign, between geoid heights derived from the Geomari GNSS observations with DT corrections from the TG (left) and PM (right) and geoid heights from the geoid models FIN2005N00, NKG2015, FIN_EIGEN-6C4 and FIN_EIGEN-6C4_GEO.
Table 3. Statistics of the differences, after the removal of offset and tilt for the whole campaign, between geoid heights derived from the Geomari GNSS observations and geoid heights from the geoid models FIN2005N00, NKG2015, FIN_EIGEN-6C4 and FIN_EIGEN-6C4_GEO, with DT corrections from the TG (left) and PM (right).
Figure 6. Differences between geoid heights derived from the GNSS observations (TG method) and geoid models after removing an offset. Solid lines present the differences with the FIN_EIGEN-6C4_GEO model. Dashed lines present the differences with the FIN2005N00 model.
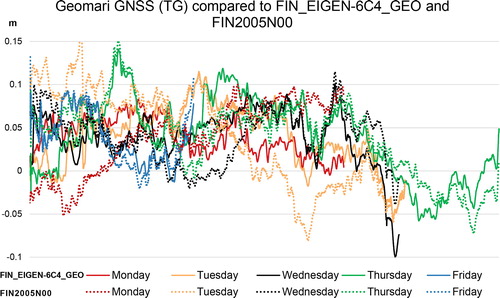
Figure 7. Differences between geoid heights derived from the GNSS observations (TG method) and geoid models after removing an offset. Solid lines present the differences with the FIN_EIGEN-6C4_GEO model. Dashed lines present the differences with the FIN_EIGEN-6C4 model.
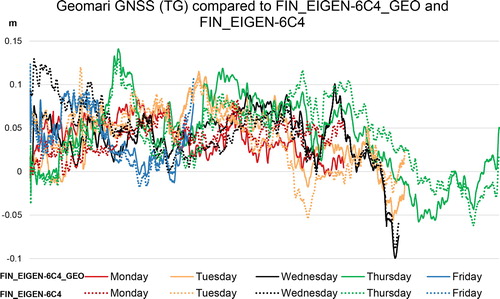
Figure 8. Differences between the GNSS derived geoid heights and the geoid models FIN2005N00 (top left), NKG2015 (top right), FIN_EIGEN-6C4 (bottom left) and FIN_EIGEN-6C4_GEO (bottom right) along the tracks of the Geomari. An offset was removed.
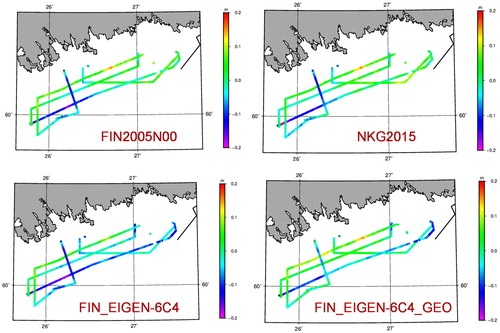
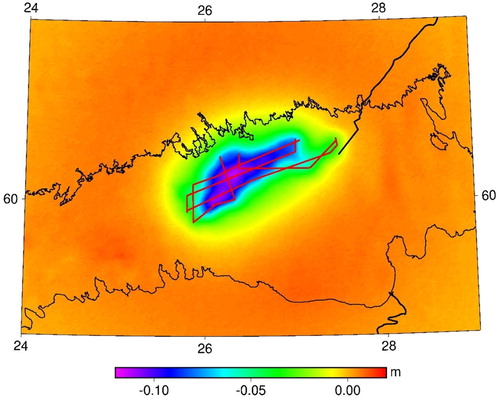
Figure 9. Differences between geoid models FIN_EIGEN-6C4 and FIN_EIGEN-6C4_GEO at the eastern part of the Gulf of Finland. Red lines are the tracks of Geomari.