
Figures & data
Figure 1. Grounding of the USS Guardian on the Tubbataha Reef (130 km southeast of Palawan, Philippines) in January 2013 (US Navy photo, public domain).
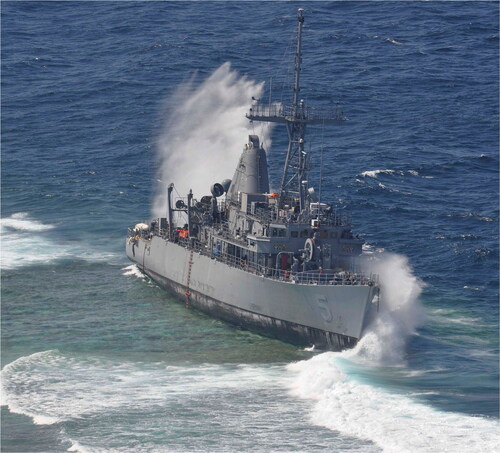
Figure 2. Human-in-the-loop framework presented in this article. Source: Author.
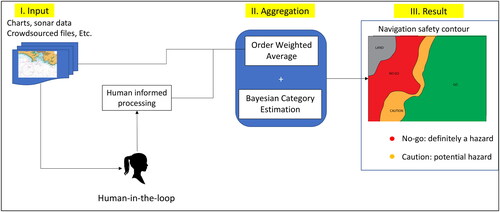
Figure 3. Case study data and area used as displayed in QGIS software. Black dots show soundings from the SOUNDG field in the ENC files, dark yellow signifies land, and light blue signifies potentially shallow water. Source: Author.
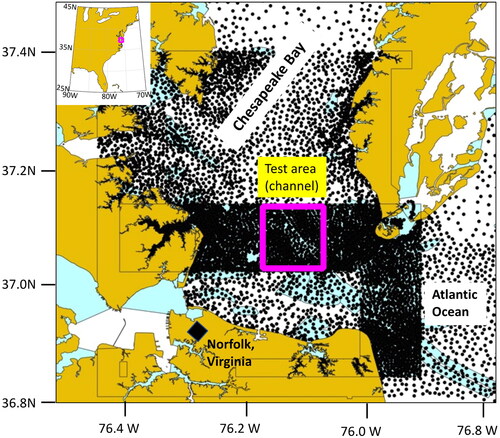
Figure 4. Sounding for the (a) Coastal chart, (b) Approach chart, and (c) Harbor Chart. Panels (d–f) are the gridded bathymetry for these cases, respectively.
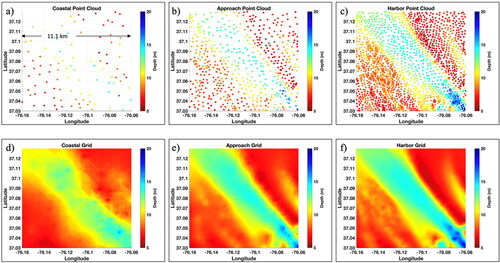
Figure 5. Panels (a, b) are aggregated bathymetry grids for the (a) shallow bathymetry surface formed by setting in the OWA process and (b) deeper bathymetry surface corresponding to
Panel (c) maps the difference between these bathymetry grids.
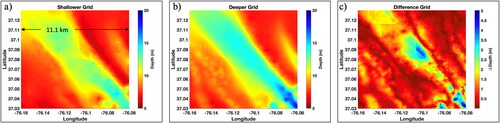
Figure 6. Navigation surface using the OWA for unnormalized reliability weightings of (a) and (b)
as discussed in the text. Source: Author.
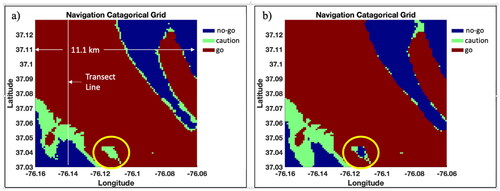
Figure 7. Navigation surface as nearest neighbors used vary from (a) K = 1, (b) K = 3, (c) K = 5, and (d) K = 10 for the 7.5-foot keel clearance case, and
Source: Author.
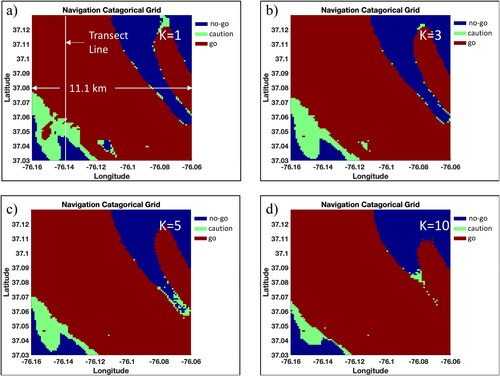
Figure 8. Same as , but for the 10-foot keel clearance case. Source: Author.
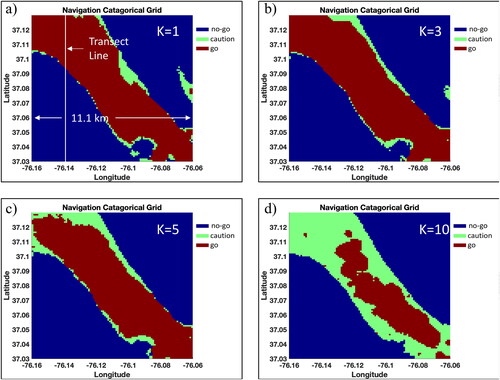
Figure 9. Navigation surface for for the 7.5-foot keel clearance case in subfigures a–c, respectively, and for the 10-foot keel clearance case in subfigures d–f. Source: Author.
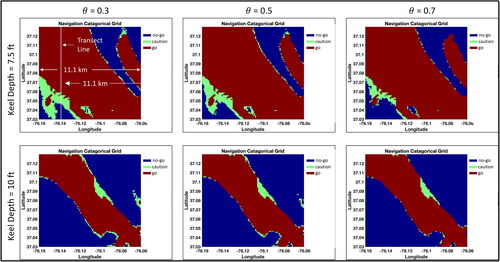
Figure 10. Transect lines for the vertical line shown in the previous figures for
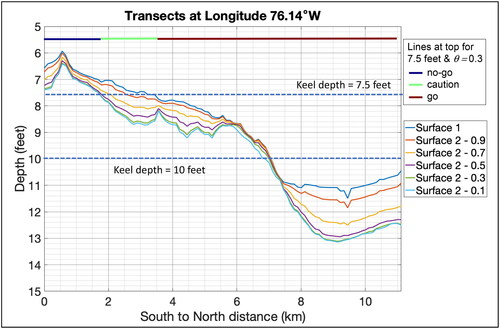
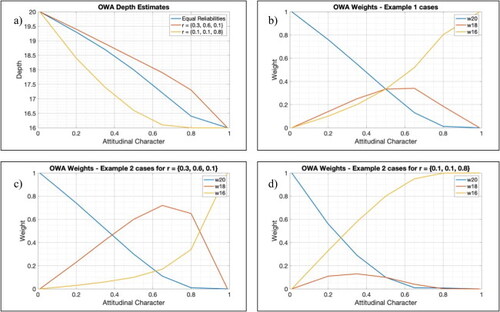
Figure A1. Graphs corresponding to the examples given in this Appendix showing depth estimates and weightings as a function of attitudinal character. Subfigure (a): depth estimates for equal reliability weighting in blue, in red, and
in yellow. Subfigures (b–d): OWA weights for the three data points (z = 20 feet in blue, z = 18 feet in red, and z = 16 feet in yellow) with attitudinal character for (b) the equal reliability case, (c) the
case, and (d) the
case.
Data availability statement
The data that support the findings of this study are openly available at https://nauticalcharts.noaa.gov/charts/noaa-enc.html.