
Figures & data
Table 1. Maximum allowable uncertainty values for the highest two IHO Orders of survey from S-44 (2020).
Figure 1. Location of low-cost RTK GNSS trials at Portobello Marine Lab (PML), Dunedin, New Zealand; a) South Island, NZ; b) PML with receiver locations shown (red points), details of each setup in ; c) Example U-blox receiver used in trials; d) MNR1 base station (Trimble R10); e) DUND base station (Trimble Net R9 CORS station); f) A24Y base station (U-blox); g) TITG tide gauge and PML tide staff (ETTS) at wharf; h-j) BBR1 (Trimble R10), BBL1 (U-blox) setup on board R/V Beryl Brewin.
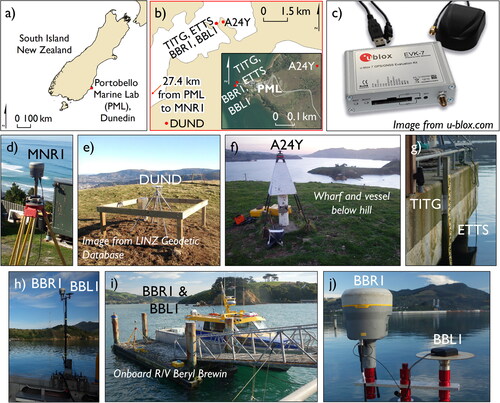
Table 2. Equipment setup at each station, cf. Figure 1.
Figure 2. Known baseline demonstration of 3D data quality for stage 1 over 7 hrs: green dots are Easting, blue dots are Northing, red dots are Up, grey bars show number of satellites; a) 7.3 km baseline; b) 27.4 km baseline.
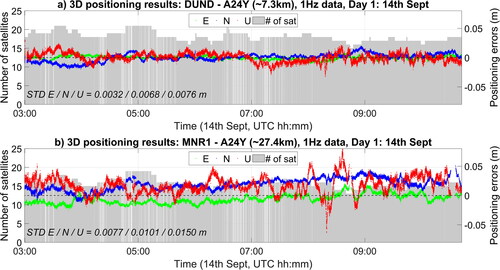
Table 3. Comparison of E, N, U values for different baseline lengths and timeframes for stage 1: Horizontal and vertical position quality checks.
Figure 3. Tide gauge to tide staff observation comparison check using two twelve hour staff reading periods.
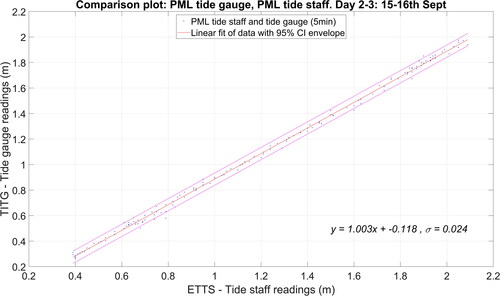
Figure 4. Tide derivation from ∼460 m baseline U-blox A24Y – BBL1 (53 hrs): a) Raw U-blox data and PML data; b) U-blox data raw and with gross spike filter plotted with corresponding PML tide gauge data; c) Raw U-blox and five minute moving average U-blox data; d) Five minute moving average U-blox data plotted with corresponding PML tide gauge data. Note: ‘Vt change / Tide (m)’ on y-axis recognizes raw RTK data (Vt change) and gauge (Tide) comparison.
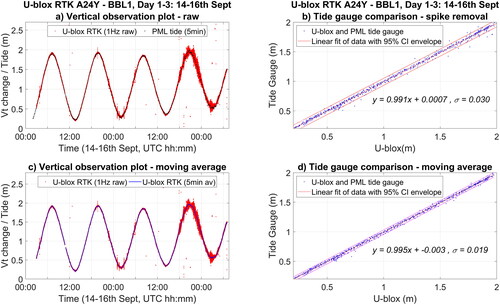
Figure 5. Tide derivation from ∼7.3 km baseline: Low-cost (a&b), R10 (c&d): DUND – U-blox BBL1 (14 hrs): a) DUND - BBL1 raw and five minute moving average; b) Five minute moving average DUND - BBL1 and PML tide gauge data; and, DUND – R10 BBR1 (∼11hrs, note that the R10 did not start logging until 14th Sept 05:10UTC): c) DUND - BBR1 raw and five minute moving average; b) Five minute moving average DUND - BBR1 and PML tide gauge data. Note: ‘Vt change / Tide (m)’ on y-axis recognizes raw RTK data (Vt change) and gauge (Tide) comparison.
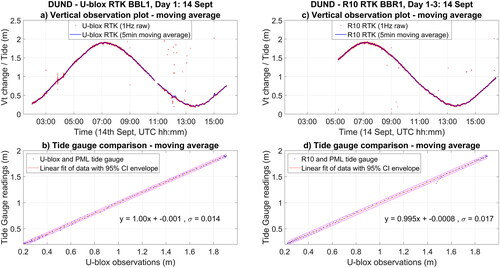
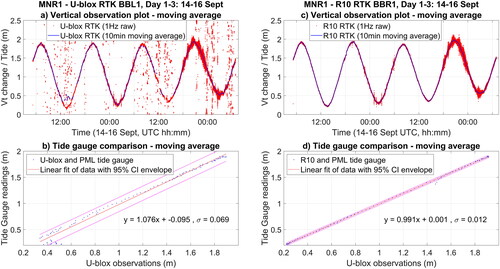
Figure 6. Tide derivation from ∼27.4 km baseline with weather deteriorating from ∼18:00 on 15th Sept visible as an increased variability in raw RTK observations: Low-cost (a&b), R10 (c&d): MNR1 – U-blox BBL1 (49.8 hrs): a) MNR1 - BBL1 raw and ten minute moving average; b) Ten minute moving average MNR1 - BBL1 and PML tide gauge data; and, MNR1 – R10 BBR10 (49.8 hrs): c) MNR1 – R10 raw and 10 min moving average; d) Ten minute moving average MNR1 – BBR1 and PML tide gauge data. Note: ‘Vt change/Tide (m)’ on y-axis recognizes raw RTK data (Vt change) and gauge (Tide) comparison.
Data availability statement
The data that support the findings of this study are available from the corresponding author, Emily Tidey, upon reasonable request.