1,753
Views
22
CrossRef citations to date
0
Altmetric
Original Articles

A Novel Aerobic Mechanism for Reductive Palladium Biomineralization and Recovery by Escherichia coli

, , , &
Pages 230-236 | Received 10 Jun 2015, Accepted 01 Jul 2015, Published online: 25 Feb 2016

Figures & data

Table 1. E. coli strains used to determine biological involvement in the reduction of palladium (II) using formate as the electron donor.

Figure 1. (A) Complete reduction of Pd(II) to Pd(0) by an aerobically grown culture of E. coli. Both bottles contain cells resuspended in 20 mM MOPS buffer at pH 7.6, and 1 mM sodium tetrachloropalladate (total volume 25 ml). This image was taken 45 min after the addition of formate to the bottle on the right. (B) Reduction by E. coli MC4100 and by controls showing no abiotic reduction of Pd(II). Controls used were killed (autoclaved) cells and cell-free suspension. Soluble Pd(II) in the supernatant was measured using ICP-MS. ▴ = MC4100; ■ = no cells; ♦ = killed cells.
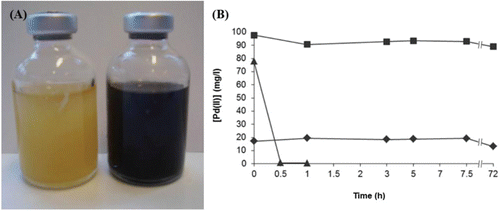
Figure 1. (A) Complete reduction of Pd(II) to Pd(0) by an aerobically grown culture of E. coli. Both bottles contain cells resuspended in 20 mM MOPS buffer at pH 7.6, and 1 mM sodium tetrachloropalladate (total volume 25 ml). This image was taken 45 min after the addition of formate to the bottle on the right. (B) Reduction by E. coli MC4100 and by controls showing no abiotic reduction of Pd(II). Controls used were killed (autoclaved) cells and cell-free suspension. Soluble Pd(II) in the supernatant was measured using ICP-MS. ▴ = MC4100; ■ = no cells; ♦ = killed cells.

Figure 2. EXAFS data showing the presence of Pd(II) at 0 and 30 min (bottom two traces), and Pd(0) at 1, 3 and 4 h (ascending series). The top trace is palladium foil.
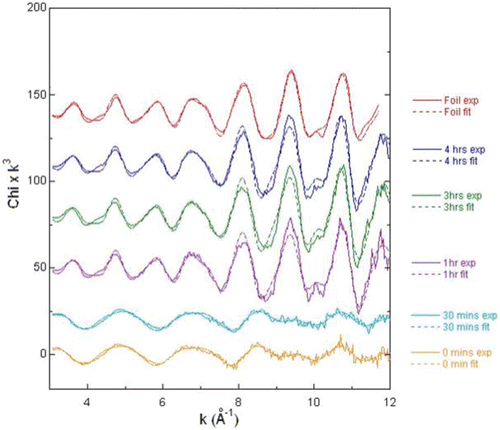
Figure 2. EXAFS data showing the presence of Pd(II) at 0 and 30 min (bottom two traces), and Pd(0) at 1, 3 and 4 h (ascending series). The top trace is palladium foil.

Figure 3. Pd(II) reduction by six different strains of E. coli, using formate as the electron donor. Soluble Pd(II) in the supernatant was measured using ICP-MS. ♦ = BW25113; □ = JW2682; ▴ = JW3865; Δ = MC4100 ΔmoaA; ■ = MC4100; ◊ = FTD128. Data points for BW25113, JW2682 and JW3865 are mean values of triplicates, with standard error shown.
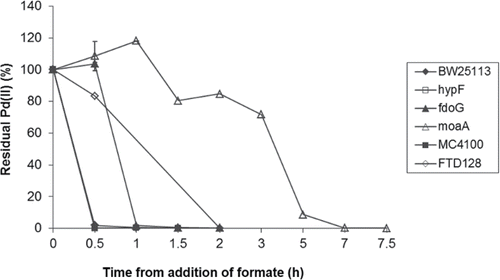
Figure 3. Pd(II) reduction by six different strains of E. coli, using formate as the electron donor. Soluble Pd(II) in the supernatant was measured using ICP-MS. ♦ = BW25113; □ = JW2682; ▴ = JW3865; Δ = MC4100 ΔmoaA; ■ = MC4100; ◊ = FTD128. Data points for BW25113, JW2682 and JW3865 are mean values of triplicates, with standard error shown.

Figure 4. TEM of thin sections of aerobically grown cells showing extracellular palladium; (A) MC4100, inset BL21; (B) BW25113, inset BL21 (no Pd); (C) FTD128; (D) JW2682; (E) MC4100 ΔmoaA; (F) JW3865. Scale bar (A) = 100 nm; (B)-(F) = 500 nm; insets = 1 μm.
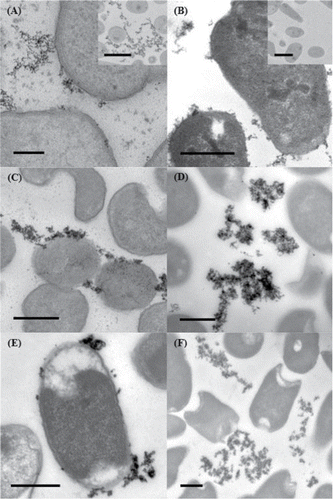
Figure 4. TEM of thin sections of aerobically grown cells showing extracellular palladium; (A) MC4100, inset BL21; (B) BW25113, inset BL21 (no Pd); (C) FTD128; (D) JW2682; (E) MC4100 ΔmoaA; (F) JW3865. Scale bar (A) = 100 nm; (B)-(F) = 500 nm; insets = 1 μm.