Figures & data
Table 1. Enrichment of iron cycling microorganisms initiated from 22 drinking water wells in Bangladesh (indicated by sample code or ID, name of the village in which the well is located, district, well depth, and physicochemical parameters).
Figure 1. (a) UPGMA cluster analysis of bacterial 16S rRNA gene-based DGGE profiles (30–55% denaturant gradient) of 22 microaerophilic iron-oxidizing enrichments, using Pearson correlation analysis as a measure of similarity. The enrichment ID refers to the location of the drinking water well (see ). Enrichments were assigned to clusters on the basis of >60% similarity. Names of enrichments belonging to a particular cluster received the same color, and this color is used in b to indicate the sequences of their excised bands. Numbers refer to the position of excised bands.
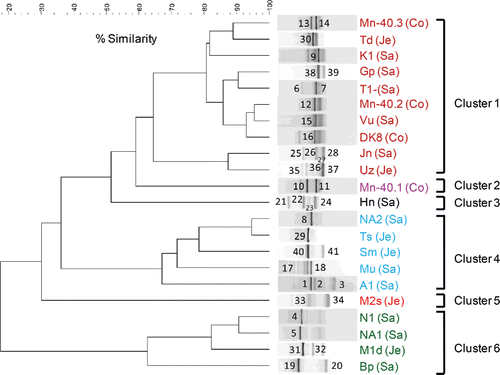
Figure 1. (b) Phylogenetic analysis of 16S rRNA gene sequences (525 unambiguously aligned nucleic acid positions) retrieved from the excised DGGE bands. Sequences are indicated by enrichment ID and the number of the excised band, as shown in (a). The three districts from which enrichments were obtained are indicated by distinct symbols: closed red circles, Satkhira; green triangles, Jessore; and blue squares, Comilla. The tree was constructed with the neighbor-joining method and bootstrap values (1000 replications) are indicated at the interior branches. The scale bar represents 5% sequence divergence.
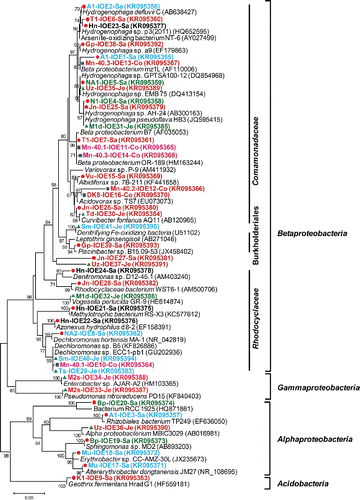
Figure 2. Unrooted neighbor-joining tree of amino acid sequences (162 unambiguously aligned positions) of the bacterial arsenite oxidase gene retrieved from iron-oxidizing enrichments. Bootstrap values (1000 replications) are indicated at the interior branches (bar = 0.1 substitutions/sequence position). The colored circles indicate the enrichments, with different colors referring to the various drinking water wells from which the enrichments were initiated. IDs in italics with colored squares indicate sequences derived directly from groundwater samples, without intermediate culturing (Hassan et al. Citation2015).
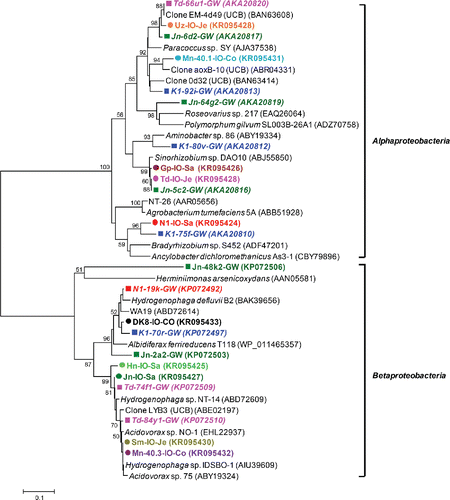
Figure 3. (a) UPGMA cluster analysis of bacterial 16S rRNA gene-based DGGE profiles (30–55% denaturant gradient) of nine iron reducing enrichments using Pearson correlation analysis to assess similarity. The enrichment ID refers to the location of the drinking water well (see ). Numbers refer to the position of excised bands.
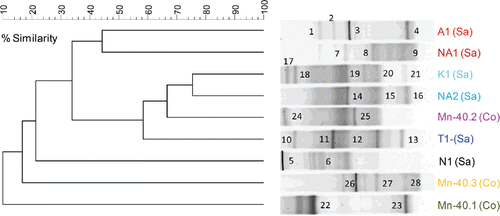
Figure 3. (b) Phylogenetic analysis of 16S rRNA gene sequences (525 unambiguously aligned nucleic acid positions) retrieved from the excised DGGE bands. Sequences are indicated by enrichment ID and the number of the excised band as shown in (a). Sequences are accompanied by a colored symbol, specific for each of the nine enrichments. The tree was constructed with the neighbor-joining method and bootstrap values (1000 replications) are indicated at the interior branches. The scale bar represents 2% sequence divergence.
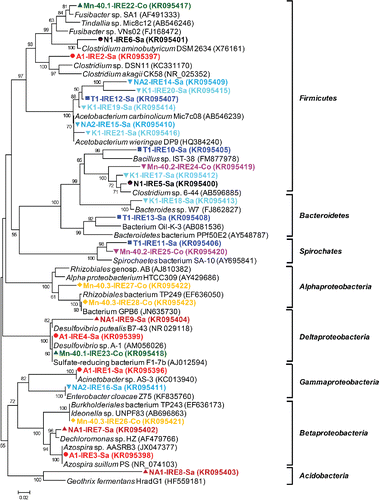
Figure 4. (a) UPGMA cluster analysis of Desulfuromonadales 16S rRNA gene-based DGGE profiles (30–55% denaturant gradient) of nine iron-reducing enrichments using Pearson correlation to assess similarity. The enrichment IDs refer to the location of the drinking water well (see for details). Numbers refer to the position of excised bands subjected to sequencing. Sequences of bands with underlined, bold numbers in italics did not belong to Desulfuromonadales.
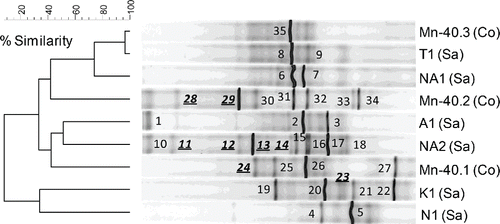
Figure 4. (b) Phylogenetic analysis of 16S rRNA gene sequences (122 unambiguously aligned nucleic acid positions) retrieved from the excised DGGE bands. Sequences are indicated by enrichment ID, the number of the excised band as shown in (a), and the district in which the well is located. Sequences are also accompanied by a colored symbol, specific for each of the nine enrichments and IDs in italics refer to water samples. The unrooted tree was constructed with the neighbor-joining method and bootstrap values (1000 replications) are indicated at the interior branches. The scale bar represents 1% sequence divergence.
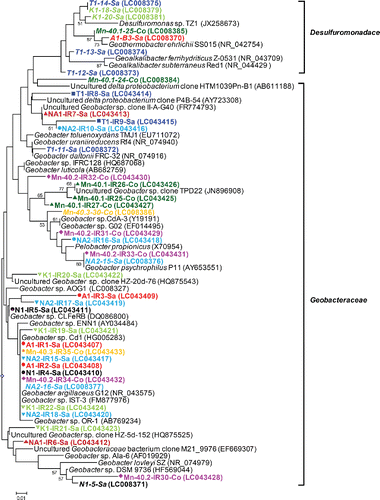
Table 2. Identities of amplified fragments of the arsenate respiratory reductase (arrA) gene (partial nucleotide sequences of 151 bp) detected in iron-reducing enrichments.
