Figures & data
Figure 1. Solubilization of manganese from MnO2 by cultures of (a) At. ferrooxidans (▲, Δ) and At. ferridurans (▼, ∇), and (b) At. thiooxidans (■, □) and At. caldus (●, ○), grown aerobically on ZVS. Closed symbols show concentrations of soluble manganese and open symbols pH. Data points are means of duplicate cultures.
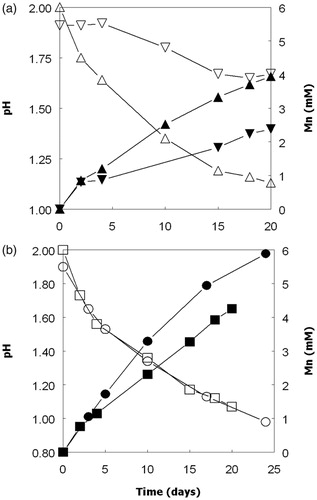
Figure 2. Correlation between pH and concentrations of soluble manganese in aerobic cultures of mesophilic Acidithiobacillus spp. grown aerobically of ZVS.
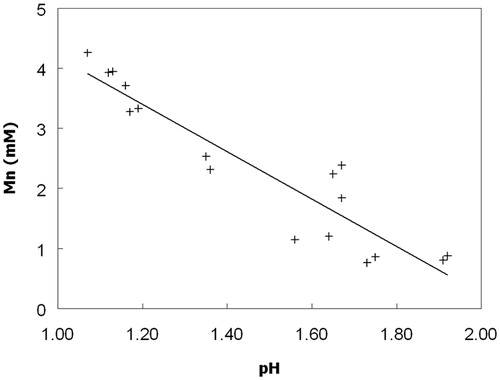
Figure 3. Solubilization of manganese from MnO2 by cultures of At. ferridurans (▼, ∇) grown aerobically on hydrogen, and non-inoculated controls (♦, ◊). Closed symbols show concentrations of soluble manganese and open symbols pH. Data points are means of duplicate cultures.
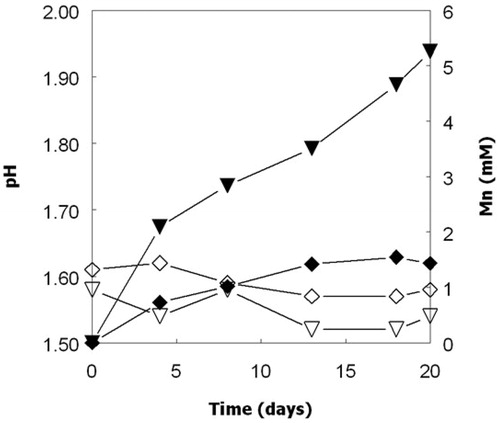
Figure 4. Solubilization of manganese from MnO2 by cultures of At. ferrooxidans (▲, Δ) and At. ferridurans (▼, ∇) grown anaerobically on hydrogen. Closed symbols show concentrations of soluble manganese and open symbols pH. The broken lines show pH values of cultures that did not contain MnO2. Data points are means of duplicate cultures.
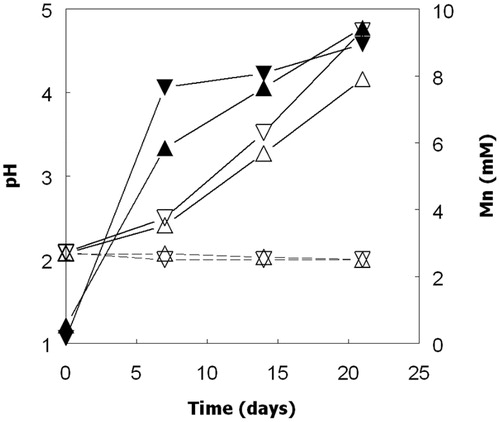
Figure 5. Concentrations of soluble manganese (shaded and hatched bars) and iron (II) (solid black bars) in cultures of At. ferrooxidans and At. ferridurans grown anaerobically on hydrogen, measured after a six day incubation period, with (shaded bars) or without (hatched bars) 5 mM iron (III) added at the start of the experiment. Manganese concentrations in non-inoculated controls either containing initially 5 mM iron (II) or no added iron are also shown (ferrous iron was not detected in controls by day 6). Error bars are range values of duplicate cultures.
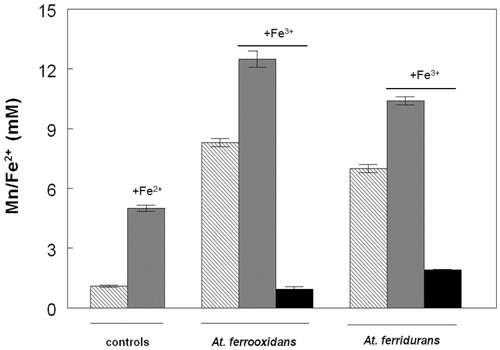
Figure 6. Changes in numbers of planktonic bacteria (closed symbols) and soluble manganese (open symbols) in cultures of (a) At. ferrooxidans (▲, Δ) and At. ferridurans (▼, ∇), and (b) At. ferriphilus (■, □) and At. ferrivorans (●, ○), grown anaerobically on ZVS (At. ferriphilus) or hydrogen (other species) in the presence of MnO2.
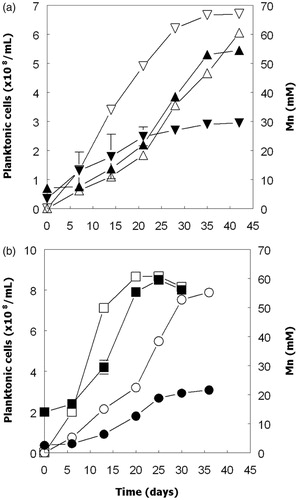
Figure 7. Changes in concentrations of ATP (closed symbols) and pH (open symbols) in cultures of At. ferridurans grown anaerobically on hydrogen (▼, ∇), and At. ferriphilus (■, □) grown anaerobically on ZVS with manganese (IV) as electron acceptor. The error bars indicate standard deviations for duplicate cultures (after averaging triplicate ATP analyses for each sample).
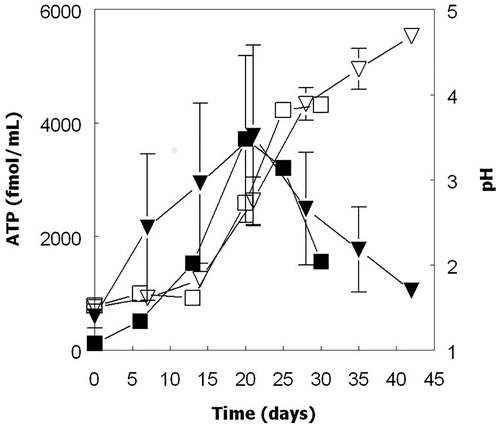
Figure 8. Comparison of growth (optical density measurements; ●, ○) and concentrations of soluble manganese (▼, ∇) in cultures of At. ferridurans grown on hydrogen as electron donor under aerobic (closed symbols) and anaerobic (open symbols). Data points are means of duplicate cultures.
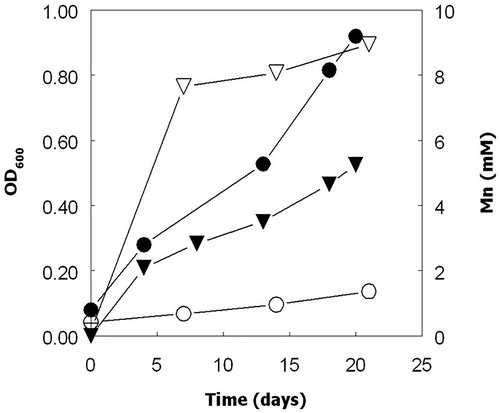
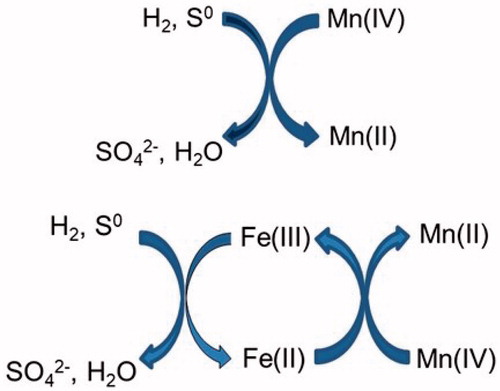
Figure 9. Schematic representation of the direct reductive dissolution of MnO2 by iron-oxidizing/reducing Acidithiobacillus spp. (top), and indirect reductive dissolution where iron is used as a shuttle vector (bottom).