Figures & data
Figure 1. Map of Hualgayoc district in Cajamarca (Peru) (A) and the localization of the three mine tunnels (PM1, PM2, and PM3) (B). Pictures showing field features of PM1, PM2, and PM3 sampling sites (C).
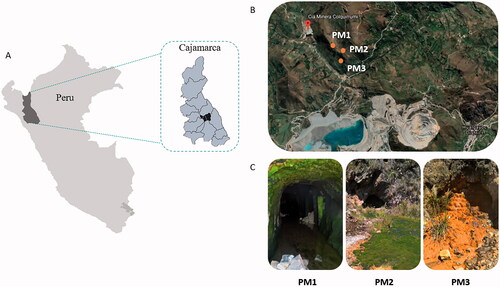
Figure 2. Sulfate reduction at low pH in microcosms from both enrichments and transfers. Glycerol (GlycPM1, PM2, PM3), acetate (AceMix), hydrogen + acetate (HydMix) and lactate (LacMix) were used as electron donors. Arrows with numbers indicate the incubation time (in days, except for glycerol microcosms in the enrichment which were in weeks (*)) and the scale time of sampling to measure pH and sulfide (rectangles), as well as sulfate and acetate (circles). GlycPM1 microcosms were not selected for sulfate measuring. GlycPM3 and LacMix microcosms were not transferred.
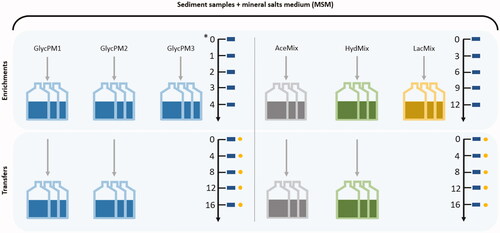
Table 1. Physico-chemical parameters -pH, ORP (mV), temperature (°C)- and chemical composition (metals and metalloid concentration in mM) measured in water samples.
Table 2. Physico-chemical parameters -pH, ORP (mV)- and major element concentration (including major oxides and trace metal(oid)s in mM units) measured in sediment samples.
Figure 3. Principal coordinate analysis (PCoA) plot of 16S rRNA sequences (A) and bar plot showing microbial composition at the phylum level in environmental samples (B). Consensus of replicates by sample type is showed in the bar plot. Taxonomic affiliation is described at right. Abbreviations: Wat PM2: water sample PM2; Wat PM3: water sample PM3; Sed PM1: sediment sample PM1; Sed PM2: sediment sample PM2; Sed PM3: sediment sample PM3.
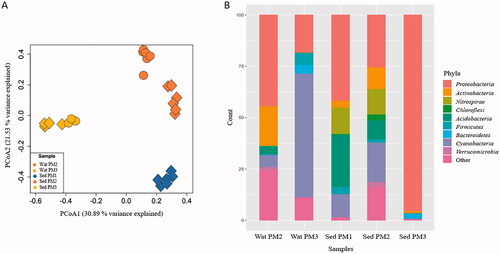
Table 3. Bacterial genera found in environmental samples of each sampling site (PM1, PM2 and PM3) and their potential metabolic profiles.
Figure 4. Principal coordinate analysis (PCoA) plot of 16S rRNA sequences (A) and bar plot showing microbial composition at the phylum level in microcosms (B). Taxonomic affiliation is described at right in the bar plot. Abbreviations: Glyc: glycerol PM1/PM2 microcosms; AceMix: acetate microcosm; HydMix: hydrogen microcosm; LacMix: lactate microcosm.
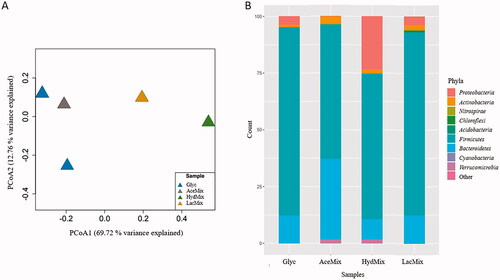
Figure 5. Heat map showing genera abundance in microcosms and cluster analysis dendrogram based on Bray–Curtis similarity. Abbreviations: GlycPM1: glycerol PM1 microcosm; GlycPM2: glycerol PM2 microcosm; AceMix: acetate microcosm; HydMix: hydrogen microcosm; LacMix: lactate microcosm.
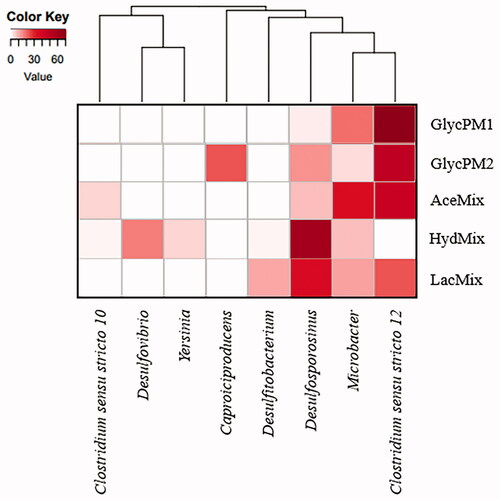
Figure 6. Geomicrobiology of water and sediment samples of PM1 mine tunnel from Hualgayoc. pH and redox potential are mentioned in each environment. Bacterial taxa and chemical compounds (oxides and sulfides) are depicted by different shapes (see legend). Bacterial metabolisms and chemical speciation of carbon, oxygen, phosphate, iron, nitrogen and sulfur are represented by arrows. Dotted arrows indicate alternative processes that can support additional bacterial metabolisms. Dotted shapes indicate alkalization propitiated by bacterial metabolism. Question marks refer to unknown components like bacteria phylotypes and metabolism products.
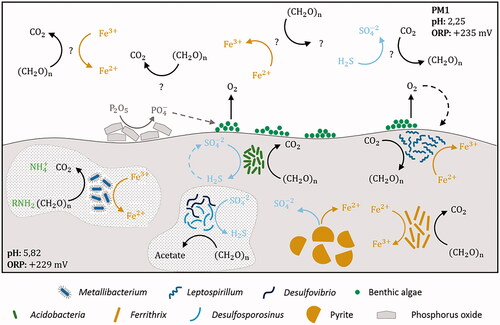
Figure 7. Geomicrobiology of water and sediment samples of PM2 mine tunnel from Hualgayoc. pH and redox potential are mentioned in each environment. Bacterial taxa and chemical compounds (oxides and sulfides) are depicted by different shapes (see legend). Bacterial metabolisms and chemical speciation of carbon, oxygen, phosphate, iron, nitrogen, sulfur and arsenic are represented by arrows. Dotted arrows indicate alternative processes that can support additional bacterial metabolisms. Dotted shape indicates alkalization propitiated by bacterial metabolism. Question marks refer to unknown components like metabolism products.
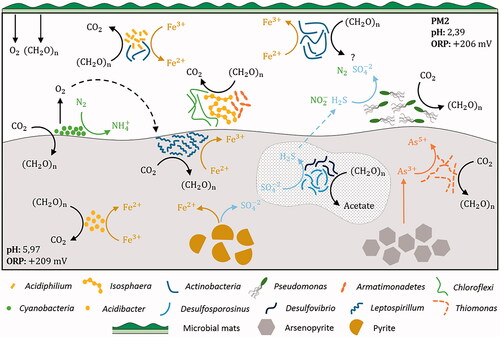
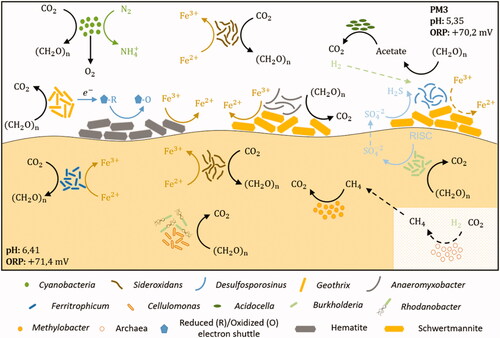
Figure 8. Geomicrobiology of water and sediment samples of PM3 mine tunnel from Hualgayoc. pH and redox potential are mentioned in each environment. Bacterial taxa and chemical compounds (oxides and sulfides) are depicted by different shapes (see legend). Bacterial metabolisms and chemical speciation of carbon, oxygen, iron, nitrogen, hydrogen and sulfur are represented by arrows. Dotted arrows indicate alternative processes that can support additional bacterial metabolisms. Dotted shape indicates the probable occurrence of archaea. RISC: reduced inorganic sulfur compound.