
Figures & data
Figure 1. PRISMA flow chart of the systematic search including n = number of studies, k = number of effect sizes.
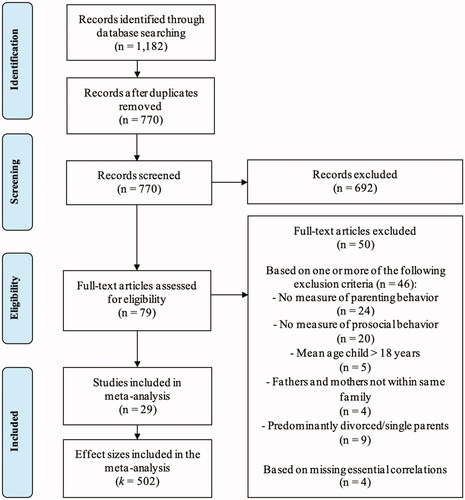
Table 1. Study characteristics and assigned parenting dimension of the included studies in this meta-analysis.
Figure 2. Funnel plot containing the effect sizes for parenting behavior—children’s prosocial behavior.
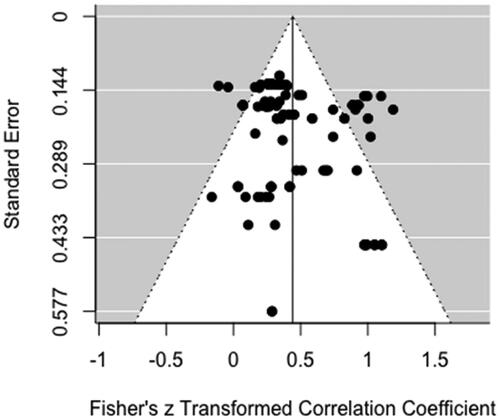
Figure 3. Funnel plots containing the effect sizes specifically for paternal parenting—children’s prosocial behavior, maternal parenting—children’s prosocial behavior, and maternal parenting—paternal parenting.
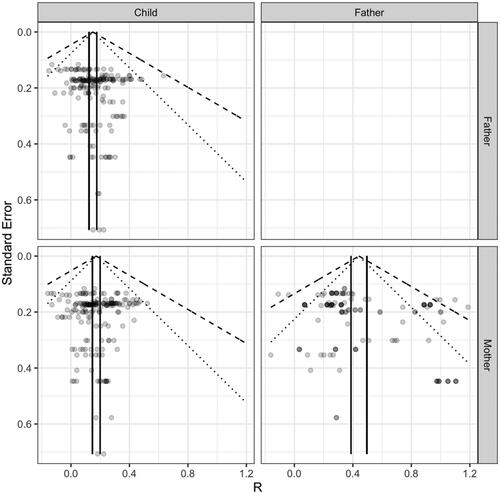
Table 2. Random effects model meta-analytic estimated pooled correlations (Pearson’s R) for relationship between parenting behavior and children’s prosocial behavior for fathers and mothers.
Figure 4. Conceptual model with relative pooled associations between mothers’ and fathers’ parenting behavior, and children’s prosocial behavior. Note. ***p <.001.
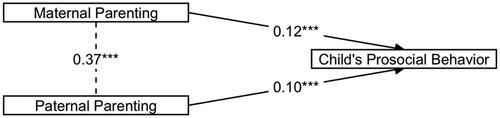
Table 3. Estimated pooled partial associations (Pearson’s R) for the relationship between parenting behavior and children’s prosocial behavior for fathers and mothers using meta-analytic structural equation modeling.
Figure 5. Overall effect sizes in our sample for the three moderation analyses we performed. A, B, and C represent three separate moderation analyses with A = parenting dimension (parental warmth, positive control, and low harsh parenting), B = study design (concurrent versus predictive), and C = average age of children in sample (pre-adolescence versus adolescence).
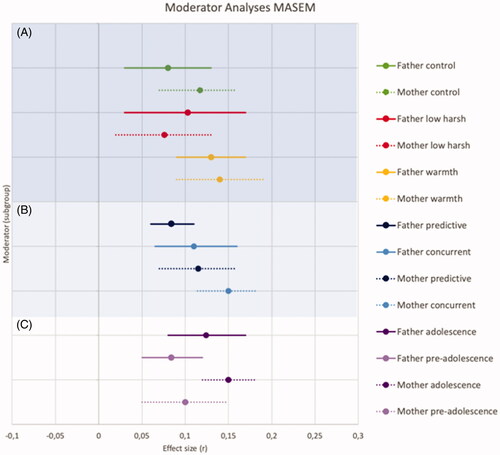
Table 4. Estimated pooled partial associations (Pearson’s R) for relationship between parenting behavior and children’s prosocial behavior for fathers and mothers in different subsamples using meta-analytic structural equation modeling.
Table 5. Differences in estimated pooled partial associations (Pearson’s R) for different subsamples within each moderator for fathers and mothers.
Data availability statement
The data and analyses that support the findings of this study are made openly available in the Open Science Framework (OSF) at http://doi.org/10.17605/OSF.IO/MHX8E.