
Figures & data
Table 1. Design of experiment (factors and levels).
Figure 1. SEM micrographs and fibre diameter distribution of: (a) PAN nanofiber, and (b) PAN-derived CNFs.
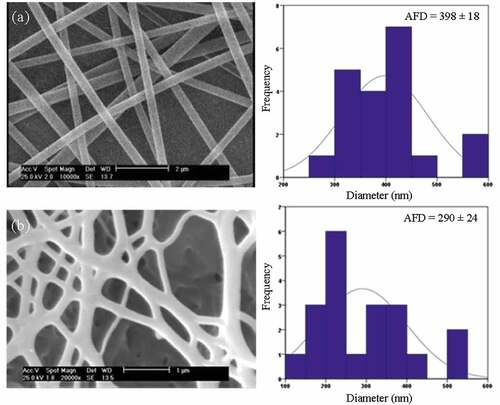
Figure 2. FTIR spectra of (a) PAN, and (b) PAN-derived CNFs.
Table 2. Experimental design and results of the central composite design.
Table 3. ANOVA analysis for responses Y1 (ethion recovery) and Y2 (fenitrothion recovery).
Figure 3. Comparison between the actual and predicted value of: (a) ethion, and (b) fenitrothion recovery.
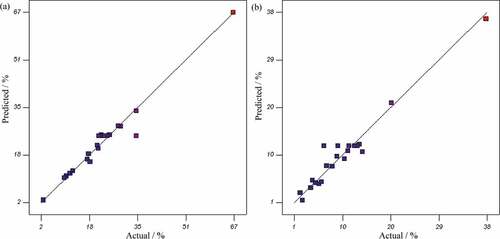
Figure 4. Main effect plots of factors on ethion recovery: (a) amount of sorbent, (b) solution pH, (c) flow rate, and (d) amount of salt.
Figure 5. Response surface and contour plots showing the effect of: (a) salt and sorbent amount, and (b) salt amount and solution pH, on ethion recovery.
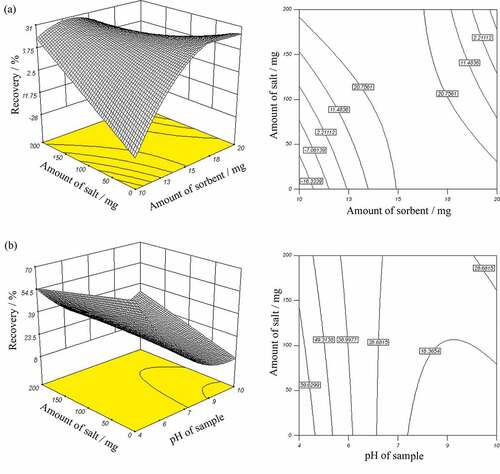
Figure 6. Response surface and contour plots showing the effect of salt and sorbent amount on fenitrothion recovery.
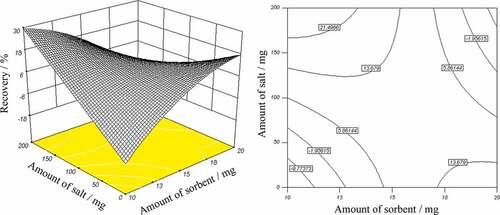
Table 4. Results of determination and recoveries of Rodsar river water samples spiked at concentration level of 3 ng mL−1 of each OPPs.
Figure 7. HPLC chromatograms of Roudsar river water sample of: (a) unspiked, and (b) spiked with 3 ng mL−1 ethion, fenitrothion and diazinon under optimized conditions.
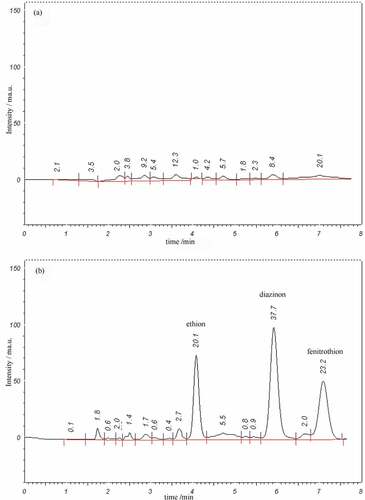
Table 5. Comparison of the current PF-SPE method with the other previously reported methods for determination of OPPs in water samples.
Table A1. SEM micrographs and fibre diameter distribution of PAN nanofibers electrospun under different conditions.