
Figures & data
Table 1. Variable definition.
Table 2. Sample.
Table 3. Descriptive statistics and mean comparison analysis.
Figure 1. (a) Employee-related disclosures over time (whole sample) (b) Employee-related disclosures over time (in ER and non-ER firms).
Note: The figure plots two disclosure variables over time. The variables are the number of paragraphs with employee-related information (Reference) and the number of employee-related words divided by the total number of words in employee-related disclosures (EM_Words). The time span includes pre – (2014–2016) and post-regulation (2017–2019) periods. (a) and 1(b) illustrate the trend in the whole sample and separately in ER and non-ER firms, respectively.
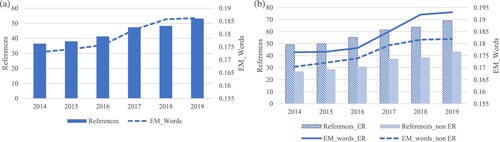
Table 4. EU Directive, employee representatives and employee related disclosures.
Table 5. Implementation of EU regulation in ER and non-ER firms.
Table 6. Analysis of the tone of employee related disclosures.