Figures & data
Table 1. Life-history parameters used for stochastic modelling of the Norfolk Island Green Parrot population. EV represents environmental variation. NA indicates where a value is not applicable.
Figure 1. Process used to convert Norfolk Island Green Parrot managed population and natural population estimates produced by VORTEX into marked and unmarked population estimates.
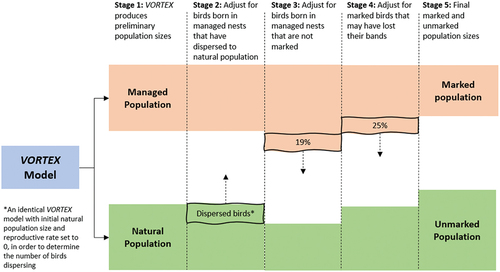
Table 2. Results of the single population models showing Norfolk Island Green Parrot population estimates for combinations of mortality rates and initial population size.
Table 3. Metapopulation models leading to a percentage of Norfolk Island Green Parrots with bands within 5% of the estimate for 2021 (17.65%) with 25% band loss. All instances for which natural breeding females have a different mortality rate to the rest of the population also incorporate a 25% reduction in reproductive output from natural nest sites.
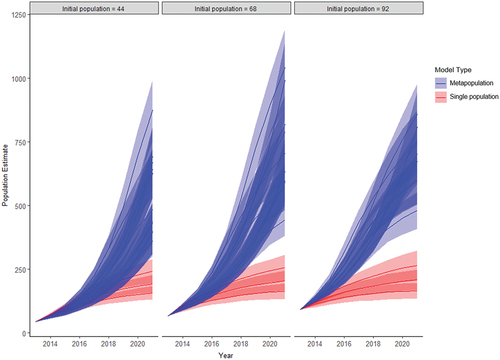
Figure 2. Yearly Norfolk Island Green Parrot population estimates produced by all single population models and metapopulation models with a comparable proportion of marked birds in the population (±5%) to that observed in the wild population in 2021 (17.65%). Ribbons indicate standard deviation of the estimates.