
Figures & data
Table 1. Percentage of threatened bird taxa in Australia with any monitoring per reporting period, considering only those taxa that were assessed as threatened in that reporting period, rather than all 166 taxa assessed across all reporting periods.
Figure 1. Decadal trends in the percentage of threatened bird taxa with any monitoring. Results are presented for ‘all’ taxa and for five broad taxonomic groups. The number of taxa assessed in each group is listed in parentheses in the legend.
Figure 2. Decadal trends in the adequacy of monitoring for Australia’s threatened bird taxa. The overall score (centre) is comprised of 10 components of monitoring assessed independently for each taxon (numbered 1–10).
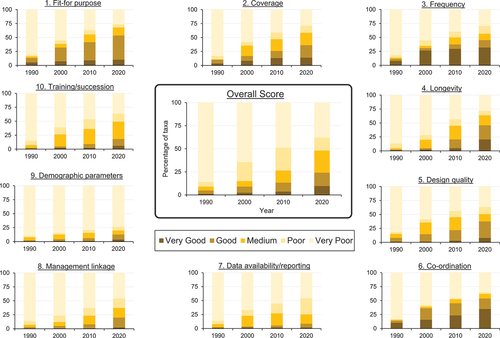
Figure 3. Decadal trends in the adequacy of monitoring for Australia’s threatened bird taxa. Results are presented for ‘all’ taxa and separately for five broad taxonomic groups. The number of taxa assessed in each group is listed in parentheses.
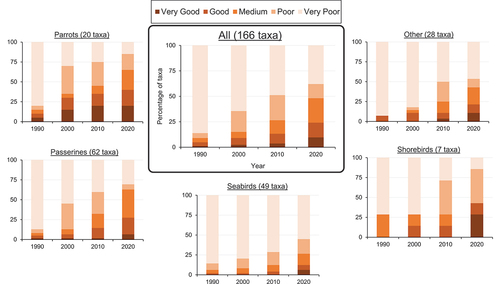
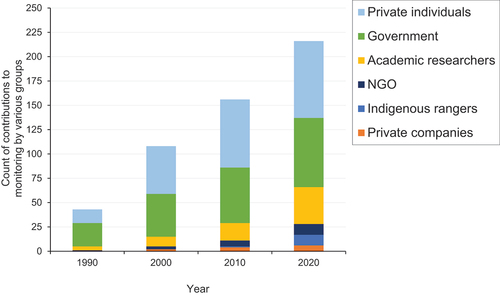
Figure 4. Decadal trends in who conducts monitoring for Australia’s threatened bird taxa. Note: multiple groups sometimes contributed to the monitoring of a single taxon. As a result, the total count of contributions to monitoring is greater than the total number of taxa monitored for any given decadal reporting period.
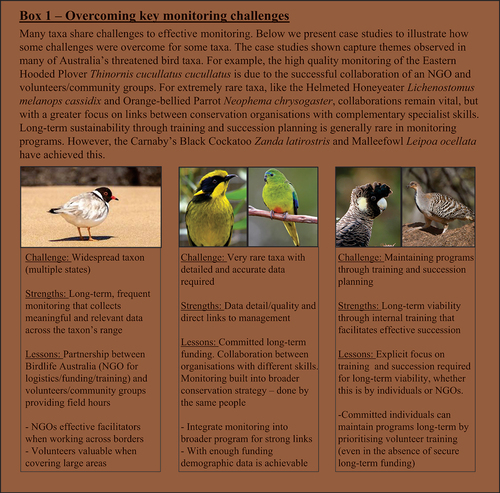
Box 1. Eastern Hooded Plover – Imogen Warren, Helmeted Honeyeater – Nick Bradsworth (Zoos Victoria), Orange-bellied Parrot – Chris Tzaros (Birds, Bush and Beyond), Carnaby’s Black Cockatoo – Georgina Steytler, Malleefowl – Simon Verdon.
Box 2. Barking Owl – John Harrison, Mallee Emu-wren – Tom Hunt, Far Eastern Curlew – G. Barry Baker.
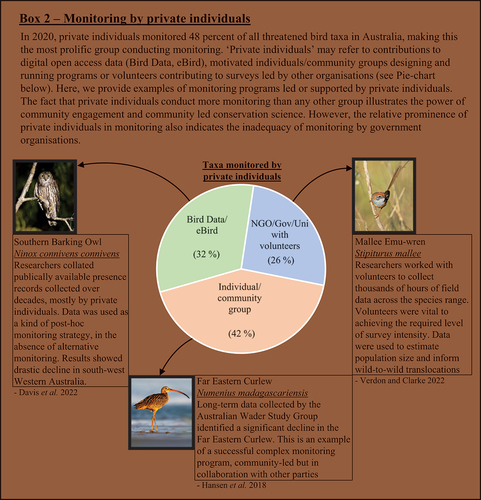
Table 2. Priority actions to improve the monitoring of Australia’s threatened birds (not in order of importance).
Supplemental Material 2
Download MS Excel (2.4 MB)Supplemental Material 1
Download MS Word (16.8 KB)Data availability statement
All data is included in Supplementary Material: https://doi.org/10.1080/01584197.2023.2275121.