
Figures & data
Figure 1. Citizen science survey effort (checklists per km2) versus success (observations per km2) for 581 native terrestrial Australian birds. Each species is plotted as a dot, with the colour of the dot indicating Australian threat status (Garnett and Baker Citation2021). Diagonal lines indicate log-bands of reporting rate (observations/checklists). The background shading divides the graph into four quadrants along the 1% reporting rate and 1 checklist per km2 lines. The top right quadrant (green) indicates species that are both well surveyed and readily detected (n = 137). The top left quadrant (yellow) indicates species that are less well surveyed but still readily detected (n = 324). The bottom left quadrant (orange) indicates species that are both poorly surveyed and scarcely detected (n = 63). The bottom right quadrant (red) indicates species that are well surveyed but still scarcely detected (n = 56).
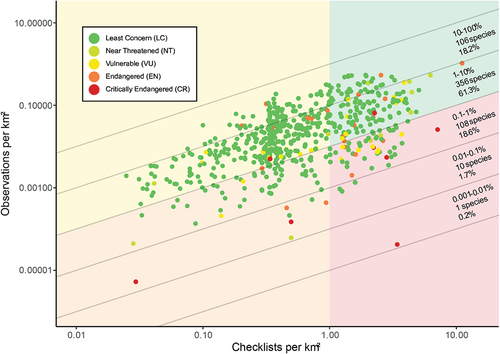
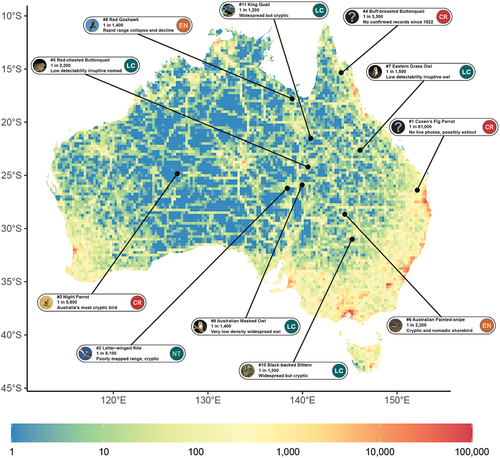
Figure 2. Map of Australia showing citizen science survey effort (checklist density) across the country, rendered as a 0.25×0.25 degree grid, and the locations (range centroids) of the eleven Australian birds with the lowest rates of citizen science survey success. These species all have reporting rates of less than one observation for every thousand checklists. At this resolution, one quarter of the continent has zero survey effort; The median number of checklists in a grid cell is 9 and the mean is 220.
Supplemental Material
Download MS Word (149.8 KB)Supplemental Material
Download MS Word (16.6 KB)Data availability statement
All datasets used have been cited in the text. A GitHub repository with full code and outputs is available at https://github.com/Louis-Backstrom/CS-Gaps-Australia.