
Figures & data
Figure 1. Number of ultrataxa of Australian birds in each IUCN Red List category (retrospectively assessed) for each year in which their status was assessed. The number of Least Concern taxa (excluded from plot) in each assessment year was: 1,138 (1990), 1,119 (2000), 1,091 (2010) and 1,054 (2020).
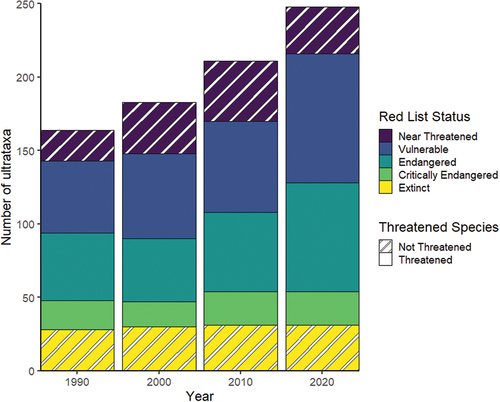
Figure 2. Genuine changes in the national IUCN Red List categories of Australian bird ultrataxa between decades (1990 to 2020). Line width represents the number of taxa moving between categories (e.g. LC [2010] to NT [2020], n = 16). Red lines represent deteriorations in status, green improvements, and grey no change. The number of taxa remaining LC between time periods is excluded: 1990 to 2000 (n = 1,119); 2000 to 2010 (n = 1,091); 2010 to 2020 (n = 1,044). LC = Least Concern, NT = Near Threatened, VU = Vulnerable, EN = Endangered, CR = Critically Endangered, EX = Extinct.
![Figure 2. Genuine changes in the national IUCN Red List categories of Australian bird ultrataxa between decades (1990 to 2020). Line width represents the number of taxa moving between categories (e.g. LC [2010] to NT [2020], n = 16). Red lines represent deteriorations in status, green improvements, and grey no change. The number of taxa remaining LC between time periods is excluded: 1990 to 2000 (n = 1,119); 2000 to 2010 (n = 1,091); 2010 to 2020 (n = 1,044). LC = Least Concern, NT = Near Threatened, VU = Vulnerable, EN = Endangered, CR = Critically Endangered, EX = Extinct.](/cms/asset/3a4033f7-71ba-4134-b7fc-6775b1552586/temu_a_2289999_f0002_oc.jpg)
Figure 3. Red List Index of species survival for Australian birds (n = 1,302 ultrataxa) between 1990 and 2020 (purple) with predicted counterfactual if 2019–2020 wildfires had not occurred (yellow). Shaded area represents 95% confidence intervals.
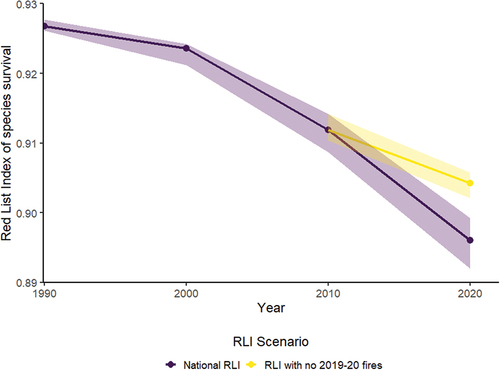
Figure 4. Red List Index of species survival for Australian birds disaggregated by geography between 1990 and 2020. Shaded area represents 95% confidence intervals.
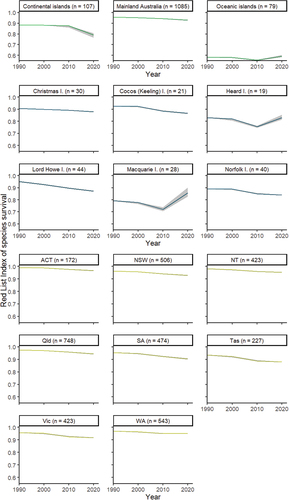
Figure 5. Red List Index of species survival for Australian birds disaggregated by habitat between 1990 and 2020. Taxa that occur in multiple habitats are included in all that were appropriate. Shaded area represents 95% confidence intervals.
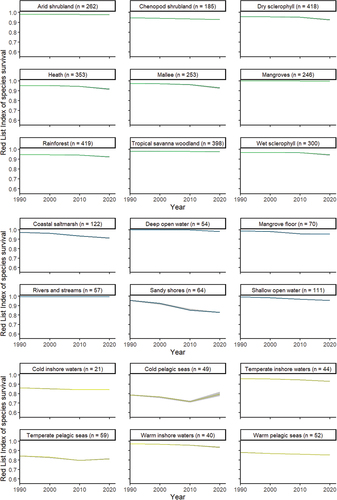
Table 1. Disaggregated mean Red List Index values for all Australian bird families with more than 15 ultrataxa. Presented in the descending order of % change 2010–2020.