
Figures & data
Table 1. Metrics related to the impact of threats on Australian threatened birds, knowledge of how to manage those threats and the management being implemented.
Figure 1. The total potential threat load to Australian threatened and Near Threatened birds inside and outside Australian territory and the realised threat load in 2010 and 2020 for 6 classes of threat (all scores normalised to 100 against total threat load across all taxa/populations; threat classes follow Kearney et al. (Citation2023; see Table S3 for how fine-scale threats are condensed into these broader threat classes).
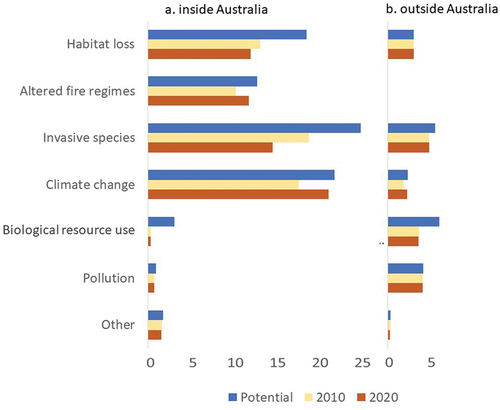
Figure 2. Trends in knowledge of how to manage threats to Australian threatened and Near Threatened birds: (a) % knowledge needs met in 2010 and 2020; comparison between the total estimated current need for knowledge of how to manage threats and that available in 2010 and 2020; (b) in Australia; (c) outside Australia; (d) relationship between % of knowledge need and % threat load relieved; (e) relationship between % knowledge need met and change in extinction risk (International Union for Conservation of Nature’s Red List category) in any decade since 1990.
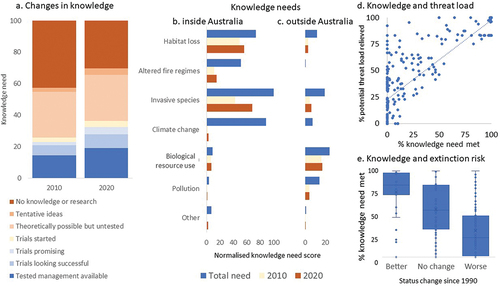
Figure 3. Management trends for Australian threatened and Near Threatened birds: (a) % management needs met in 2010 and 2020; comparison between the total current estimated need for management and that being undertaken in 2010 and 2020; (b) in Australia; (c) outside Australia; (d) relationship between % of knowledge need and % threat load relieved; (e) relationship between % knowledge need met and change in extinction risk (Internation Union for Conservation of Nature Red List category) in any decade since 1990.
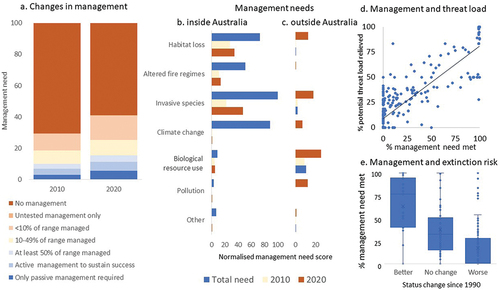
Figure 4. Trends in the management of the 10 most important fine-scale threats to threatened and Near Threatened Australian birds in 2020: (a) % of the total threat load for all Australian birds; (b) % total knowledge need met; (c) % total management need met. Of the 201 threats identified, the top 10 encompassed 51.3% of the total threat load.
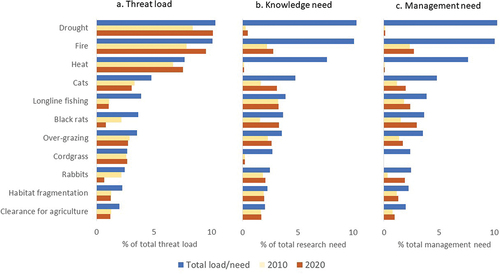
Table 2. The 20 threatened or Near Threatened Australian bird taxa ranked highest in 2020 for estimated threat load, the need for knowledge of how to manage threats effectively and for the need to implement known threat mitigation approaches. Scores in brackets are normalised to 100.
Supplemental Table 12
Download MS Word (99.8 KB)Supplemental Table 11
Download MS Word (68.3 KB)Supplemental Table 10
Download Comma-Separated Values File (1.1 MB)Supplemental Table 9
Download Comma-Separated Values File (5.2 KB)Supplemental Table 8
Download Comma-Separated Values File (24.7 KB)Supplemental Table 7
Download MS Word (20.7 KB)Supplemental Table 6
Download MS Word (22.9 KB)Supplemental Table 5
Download MS Word (16.2 KB)Supplemental Table 4
Download MS Word (26.4 KB)Supplemental Table 3
Download MS Word (28.5 KB)Supplemental Table 2
Download MS Word (40 KB)Supplemental Table 1
Download MS Word (13 KB)Supplemental Figure 4
Download PNG Image (486.8 KB)
Supplemental Figure 3
Download PNG Image (1.2 MB)
Supplemental Figure 2
Download PNG Image (20.1 KB)
Supplemental Figure 1
Download PNG Image (47.1 KB)
Data availability statement
All data are available in the supplementary materials.