Figures & data
Figure 1. Annual percentage change for United States: real GDP, labor productivity, and TFP. Notes: Labor productivity and TFP are from OECD Productivity Statistics. Real GDP is from BEA in 2012 dollars.
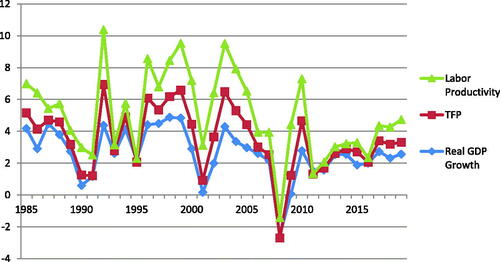
Table 1. Comparing real GDP growth, labor productivity, and TFP.
Table 2. Employment by major industry sector (employment in thousands of jobs).
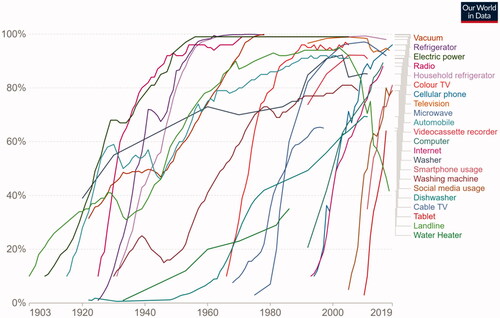
Figure 2. Share of US households using specific technologies, 1903–2019. Source: OurWorldinData.org. See also Desjardins (Citation2018). Much of the data were part of The CHAT Data Set (Comin and Hobijn Citation2009).