Figures & data
Figure 1. (a) Real GDP growth. (b) Unemployment rate.
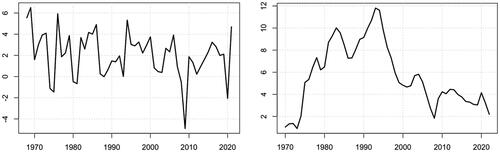
Figure 2. (a) Adjusted wage share. (b) Current account to GDP.
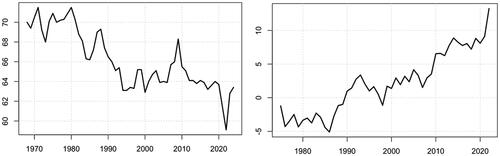
Figure A1. Impact of stronger unions on income distribution, utilization and accumulation.
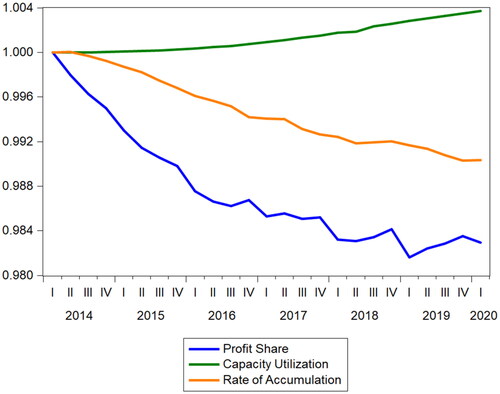
Figure A2. Impact of stronger unions on aggregate demand.
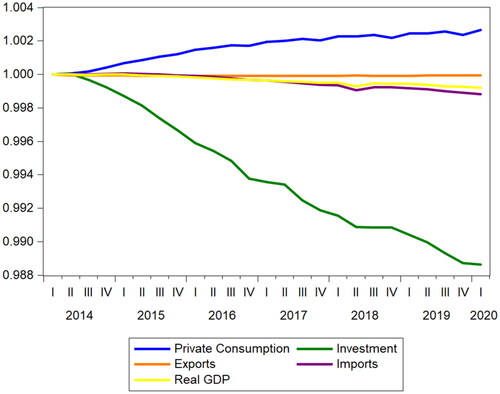
Figure A3. Impact of stronger unions on the determinants of NFC’s investment.
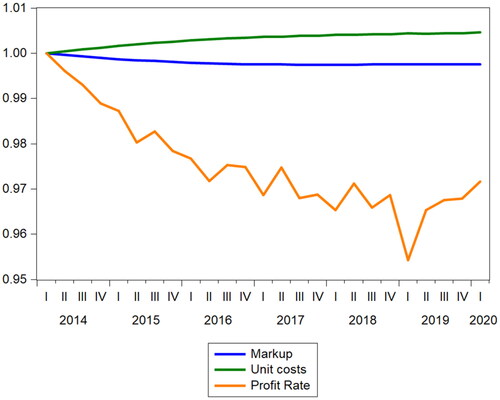
Figure A4. Impact of stronger unions on the determinants of Households’ consumption.
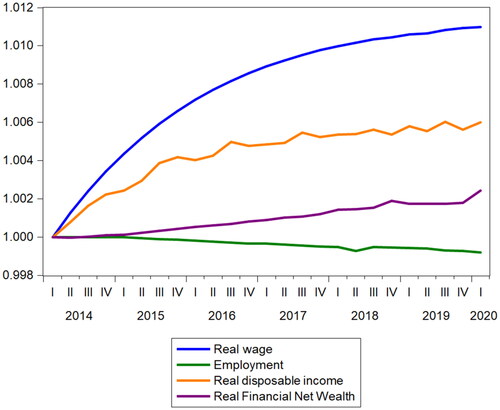
Figure A5. Impact of stronger unions on the determinants of foreign trade.
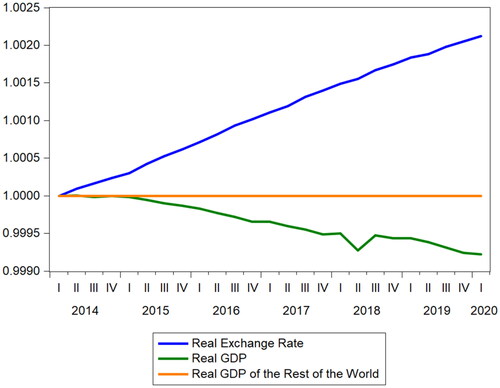
Table C1. Financial balance sheet for Denmark – ‘+’ expresses an asset, while ‘-‘ is associated with a liability.
Table C2. Transaction flow matrix for Denmark – ‘-’ is associated with an outflow of the sector.
Figure E1. Real GDP and employment, actual vs baseline model.
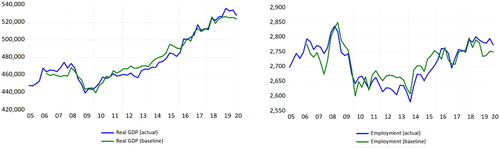
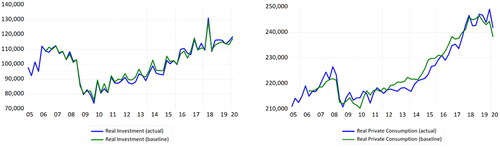
Figure E2. Real investment (left) and real consumption (right).