
Figures & data
Figure 1. Maintenance problem in Jutland.
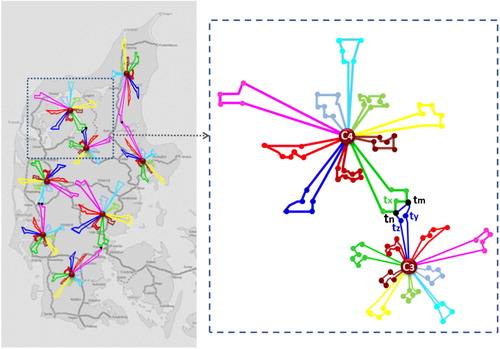
Figure 2. An illustration of our proposed approach for solving the problem in a stage-based manner.
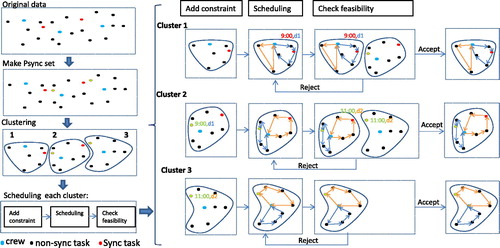
Figure 3. An example of the three ordering strategies.
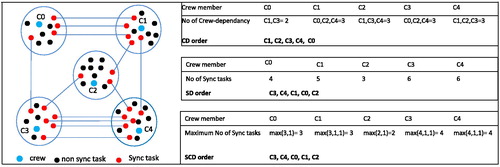
Figure 4. This figure illustrates the order in which the entire scheduling problem is solved for several crew members (depots) over several days (routes), with special focus on the synchronised tasks which make the problem non-decomposable.
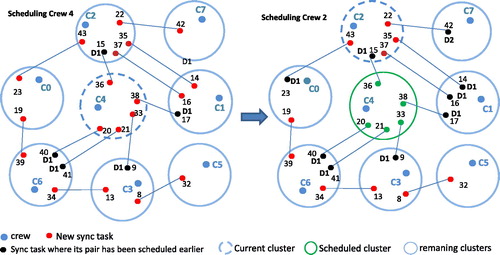
Table 1. This table illustrates the update process for Tuplesync as the schedule for each cluster is decided.
Figure 5. Three possible situations of the generated routes in one cluster after the scheduling step.
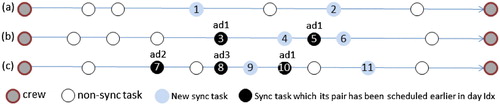
Figure 6. Geographical visualisation of the dataset.
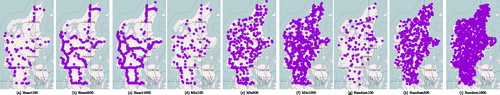
Table 2. Comparison between the proposed constructive framework and a MIP solver on small data instances.
Table 3. Results of solving the nine datasets based on three different cluster ordering methods.
Table 4. The results for individual clusters based on SD ordering for the on track data instances.
Table 5. Solution quality statistics per clusters for problem instances with 100 tasks.