
Figures & data
Table 1. The CO2 emission/GIOV in China from 2004 to 2012.
Table 2. Notation summary.
Table 3. A simple example.
Table 4. Preliminary results.
Table 5. The constraint generation process for the minimal excess value.
Table 6. Dataset for 31 sub-level manufacturing industries.
Figure 1. Normalized carbon emissions and carbon emission intensity.
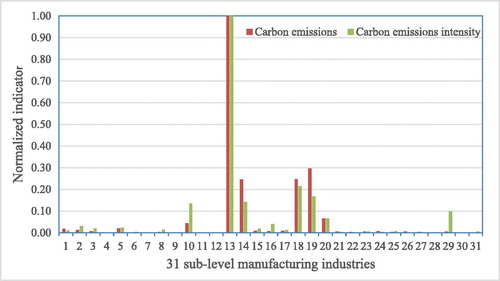
Figure 2. Relative efficiency of 31 sub-level manufacturing industries.
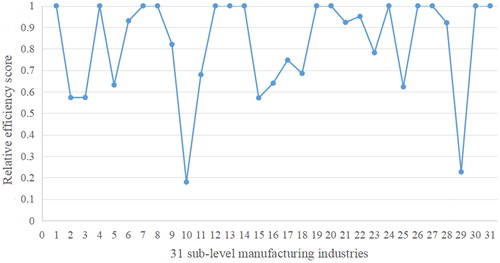
Table 7. CO2 abatement quota allocation for 31 sub-level manufacturing industries.
Table 8. Relationship associated with the allocation results.
Table 9. Summary statistics of 31 provinces for 31 sub-industries.
Table 10. Results of regional CEA allocation scheme (unit: thousand tons).
Table 11. Results of regional CEA allocation scheme (unit: thousand tons).
Table 12. Results of regional CEA allocation scheme (unit: thousand tons).
Table 13. CO2 abatement quota allocated to provinces (10 thousand tons).
Figure 3. Percentage of carbon emissions and abatement quota for 31 provinces.
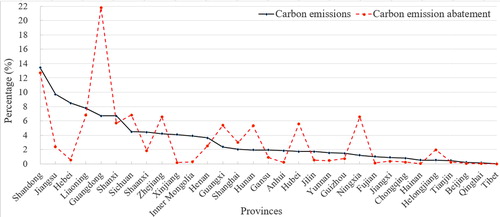
Table F1. The codes for two-digit Chinese manufacturing industries