Figures & data
Figure 1. Expansion of Moria irregular accommodation (Lesvos). The yellow boxes illustrate structural expansions between each year. The Greek government has announced the closure of this structure which will be replaced by a new one capable of hosting 5000 people initially. The satellite imagery belongs to Maxar technologies and was acquired through Google Earth.
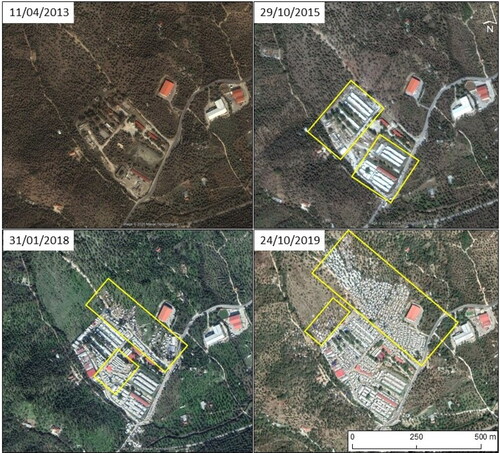
Figure 2. Potential locations of migrant accommodation centres and suggested capacities per island. The basemap used is ESRI World imagery. The Greek and Turkish administrative boundaries used are from the Regional IM Working Group - Europe.
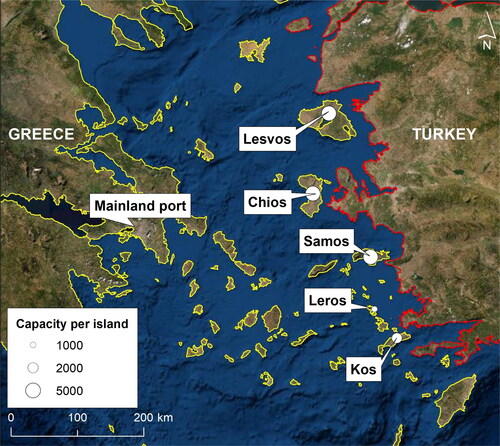
Table 1. Model notation.
Table 2 Input data used for the experiments.
Figure 3. Outputs obtained by ADP for various cost coefficients.
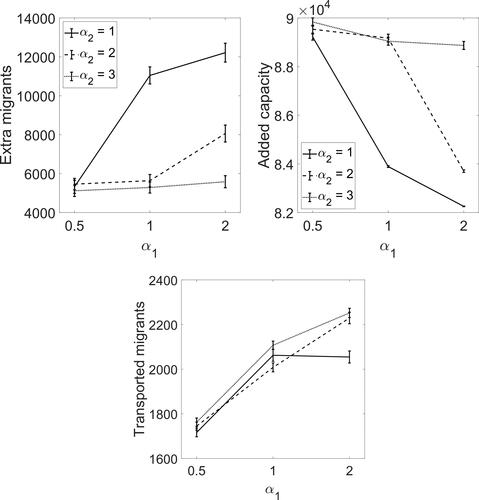
Table 3. Policy for a randomly chosen scenario.
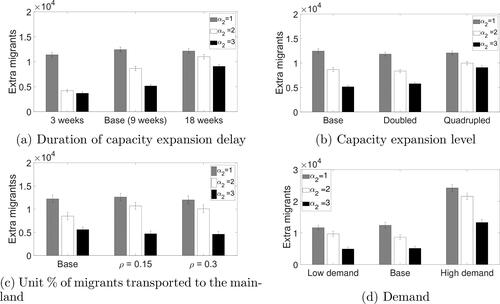
Figure 4. Extra migrants for various costs of overcrowding in the sensitivity tests.