
Figures & data
Figure 1. An illustration of a k-depth BFS tree.
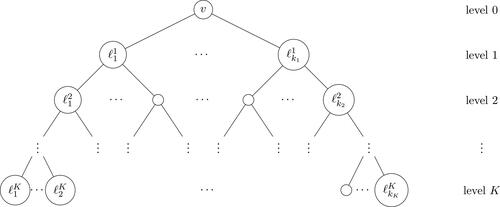
Table 1. Characteristics of real world graph instances.
Table 2. Characteristics of NetworkX-generated synthetic graph instances.
Table 3. Parameter settings for computational experiments.
Table 4. Results for Real-world instances: Optimal value of objective function (Opt) and summary results for heuristic (minimum (min), mean (avg), maximum (max), and standard deviation (SD)) for budget settings
Figure 2. Summary results of heuristic algorithm compared with exact over synthetic instances.
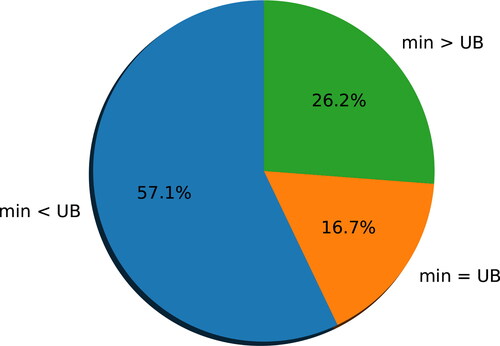
Figure 3. Comparison of gaps from best UB and Heuristic for the synthetic instances, B = 0.05 n.
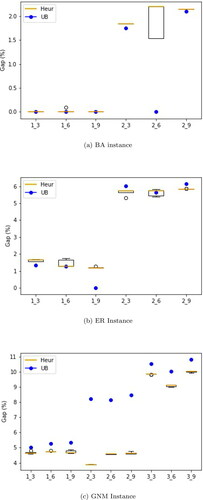
Figure 4. Comparison of gaps from best UB and Heuristic for the synthetic instances, B = 0.1 n.
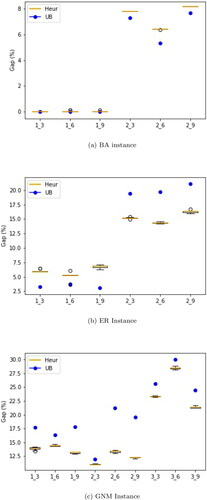
Figure 5. Variation of average percentage improvement in objective function values following the neighbourhood search procedure across different synthetic network types; budget settings and
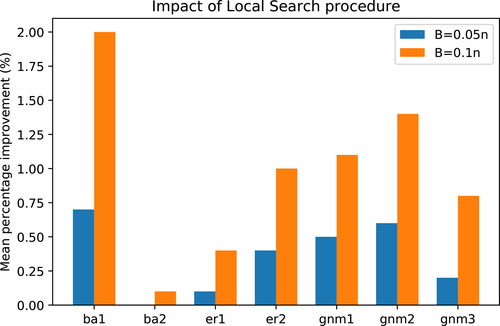
Table 5. Results for synthetic instances: Exact Lower and Upper bounds (LB, UB) and summary statistics for heuristic (minimum (min), mean (avg), maximum (max), and standard deviation (SD)) for budget settings
Table 6. Results for benchmark synthetic instances: Exact Lower and Upper bounds (LB, UB) and summary statistics for heuristic (minimum (min), mean (avg), maximum (max), and standard deviation (SD)).
Figure 6. Comparison of three-parent and two-parent backbone crossover approaches.
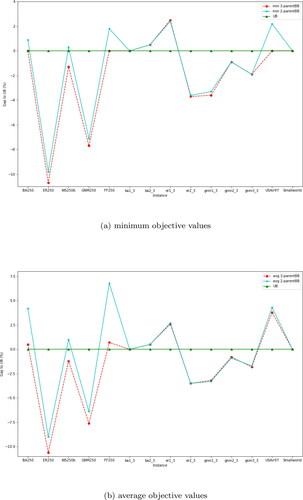
Table 7. Comparison of the proposed heuristics using three-parent and two-parent backbone crossover approaches on a set of test instances, except for FF250 where B = 13 as recorded from the source of the data.