

Abstract
A major requirement for credit scoring models is to provide a maximally accurate risk prediction. Additionally, regulators demand these models to be transparent and auditable. Thus, in credit scoring, very simple predictive models such as logistic regression or decision trees are still widely used and the superior predictive power of modern machine learning algorithms cannot be fully leveraged. Significant potential is therefore missed, leading to higher reserves or more credit defaults. This article works out different dimensions that have to be considered for making credit scoring models understandable and presents a framework for making “black box” machine learning models transparent, auditable, and explainable. Following this framework, we present an overview of techniques, demonstrate how they can be applied in credit scoring and how results compare to the interpretability of scorecards. A real world case study shows that a comparable degree of interpretability can be achieved while machine learning techniques keep their ability to improve predictive power.
Disclosure statement
No potential conflict of interest was reported by the authors.
Figure 1. The process description consists of four components. The first defines the stakeholders that are affected by the model. The second defines the life cycle of the model and specifies which stakeholders are active in which part of the model life cycle. The third specifies at which time which stakeholders have what needs related to the model. The last component sets out the machine learning techniques that can be used to meet the identified needs.
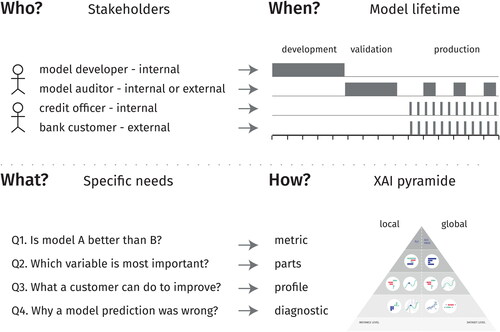
Figure 2. A detailed view on the pyramid setting out the machine learning techniques that can be used for explainability.
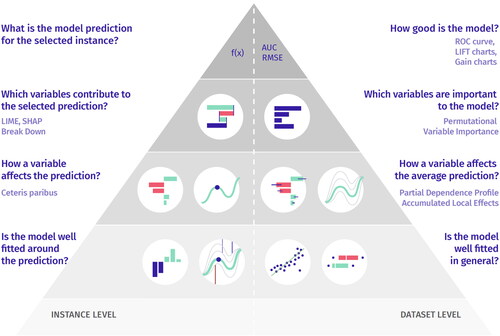
Figure 3. Example: automatic vs. manual binning for the variable months since the most recent delinquency.
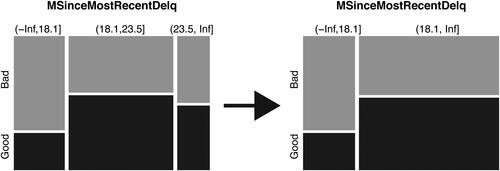
Figure 4. Model performance measured by AUC on test data.
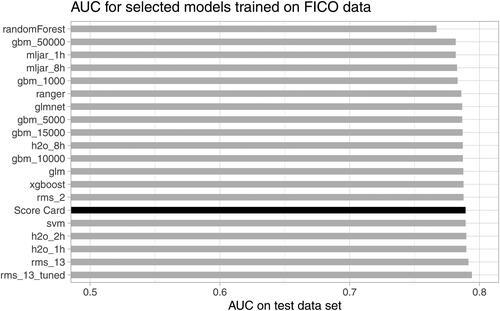
Figure 5. Selection of models for comparison based on AUC on training and test data. The black line corresponds to an AUC that is equal on training and test sets. The included models are gradient boosting machines (“gbm”) with different numbers of trees, logistic regression (“glm”), elastic net (“glmnet”), logistic regressions with spline based transformations (“rms”), two implementations of random forest (“randomForest,” “ranger”), support vector machines (“svm”), and extreme gradient boosting (“xgboost”) as well as H2O’s AutoML (“h2o”) and MLJAR AutoML (“mljar”) trained for varying amounts of time.
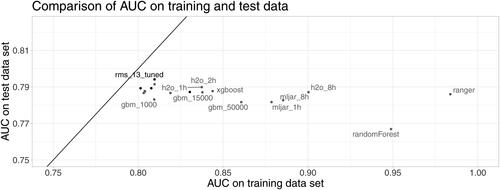
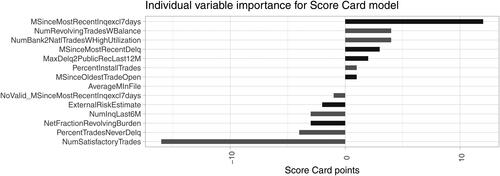
Figure 12. Scorecard Points for a single prediction as individual explanation of variable importance.
Acknowledgements
The authors sincerely thank two anonymous reviewers whose comments and suggestions helped improve and clarify this manuscript substantially.