
Figures & data
Figure 1. Schematic depiction of a patient trajectory and timeline.
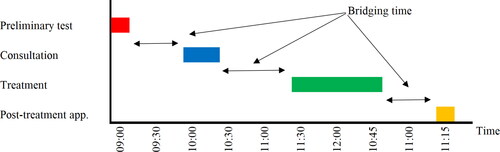
Table 1. Sets, parameters and variables.
Table 2. Appointment types rheumatology clinic SMK. Each appointment type is accompanied with its stage and duration (in minutes). The colour of a trajectory corresponds to the blueprint schedule from .
Table 3. Trajectories rheumatology clinic SMK. For each trajectory the appointment type per stage is denoted together with the option to replace a consultation with a digital consultation, the minimum bridging times (in minutes) and the number of occurrences required in the blueprint schedule. The duration of every appointment type can be found in . The colour of a trajectory corresponds to the blueprint schedules from .
Figure 2. The pre-COVID-19 blueprint schedule (a) and its best-case realisation (b) for the rheumatology clinic of SMK. In both (a) and (b), at the top is the blueprint schedule for nurses (Stage 2) and at the bottom is the blueprint schedule for physicians and PAs (Stage 3). Along the x-axis is the time and along the y-axis is the resource (at the bottom resources 1 – 7 are the physicians and 8 – 10 the PAs). In (c) the waiting room occupancy corresponding to the blueprint schedule from (b) is depicted over time. Here the grey bars denote waiting area occupancy levels taking into account bridging and average early arrival times (result from the ILP) and the blue line, together with its 95% confidence interval as the shaded area, depicts the waiting area occupancy including randomness in early arrival and consultation times (result from the MCS).
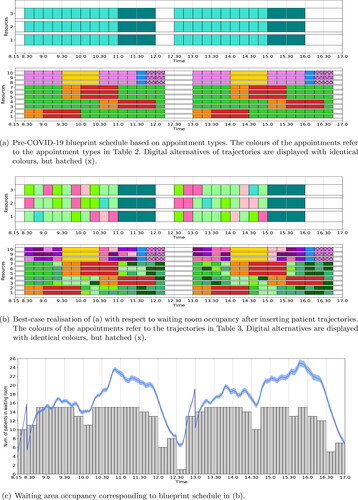
Table 4. Trajectories medical oncology & haematology clinic UMCU. For each trajectory the appointment type per stage is denoted together with the option to replace a consultation with a digital consultation, the minimum bridging times (in minutes) and the number of occurrences required in the blueprint schedule. The colour of a trajectory corresponds to the blueprint schedules in .
Figure 3. Optimal blueprint schedule (a) for the rheumatology clinic of SMK when only the number of in-person consultations is maximised; and the corresponding waiting room occupancy (b) for three variability settings. We refer to the caption of for a more detailed explanation of the figure.
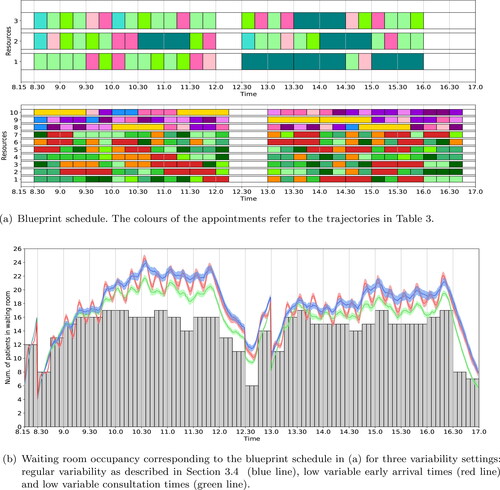
Figure 4. Optimal blueprint schedule (a) and waiting room occupancy (b) for the rheumatology clinic of SMK when the number of in-person consultations is maximised; the waiting room occupancy is levelled; and appointment types are evenly distributed over all resources. We refer to the caption of for a more detailed explanation of the figure.
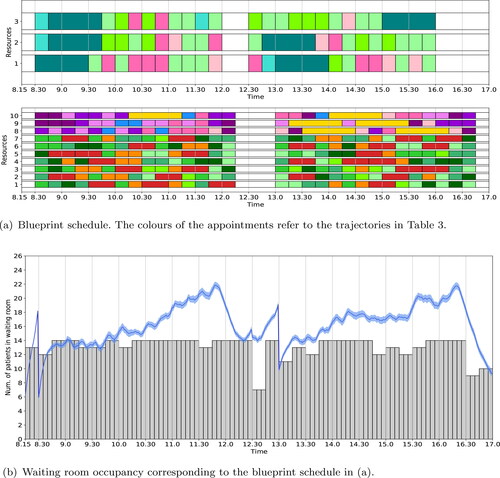
Figure 5. Optimal blueprint schedule (a) and waiting room occupancy (b) for the rheumatology clinic of SMK when the waiting room capacity is set to its minimum necessary to schedule all required occurrence for each trajectory. We refer to the caption of for a more detailed explanation of the figure.
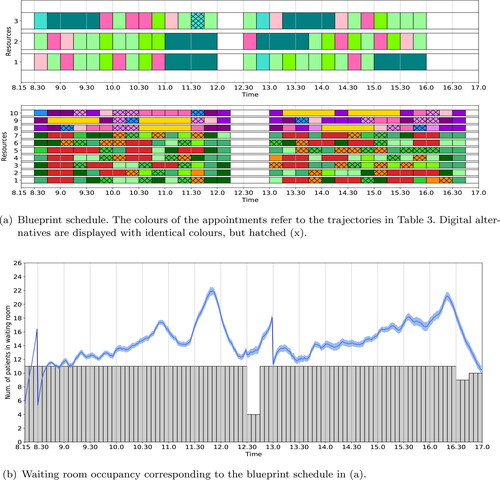
Figure 6. Optimal blueprint schedule (a) and waiting room occupancy (b) for the rheumatology clinic of SMK with time-dependent restrictions on the number of patients simultaneously allowed in the waiting room. We refer to the caption of for a more detailed explanation of the figure.
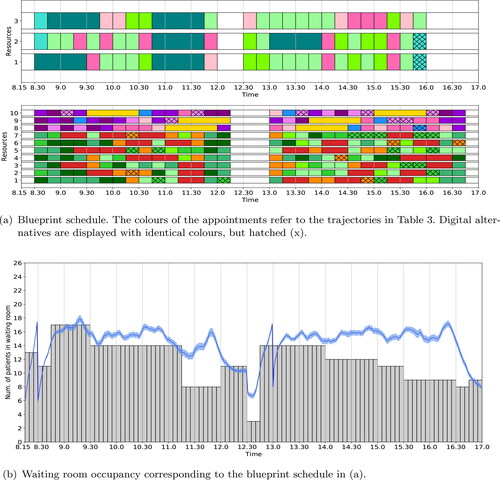
Figure 7. Optimal blueprint schedule (a) and waiting room occupancy (b) for the rheumatology clinic of SMK when the number of trajectories is reduced to 90% of the total case mix. We refer to the caption of for a more detailed explanation of the figure.
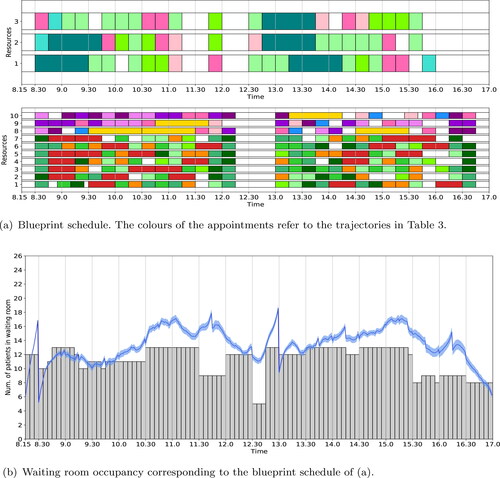
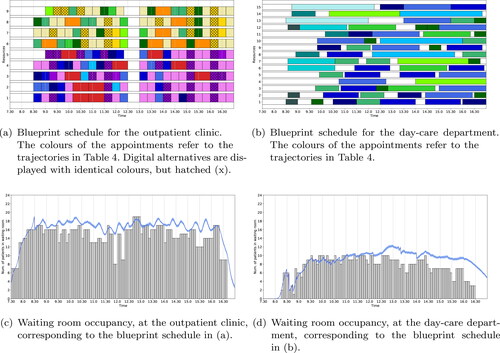
Figure 8. Optimal blueprint schedule of the outpatient clinic (a) and day-care department (b) for the medical oncology & haematology clinic in UMCU when only the number of in-person consultations is maximised. Along the x-axis is the time and along the y-axis is the resource (in (a) resources 1 – 4 and 5 represent the oncologists and oncology PA, resp., and resources 6 – 8 and 9 represent the haematologists and haematology PA, resp.). In (c) and (d) the waiting room occupancy for the outpatient clinic and day-care department, resp., is depicted over time. Here the grey bars denote waiting room occupancy levels taking into account bridging and average early arrival times (result from the ILP) and the blue line, together with its 95% confidence interval as the shaded area, depicts the waiting room occupancy including randomness in early arrival and consultation times (result form the MCS).
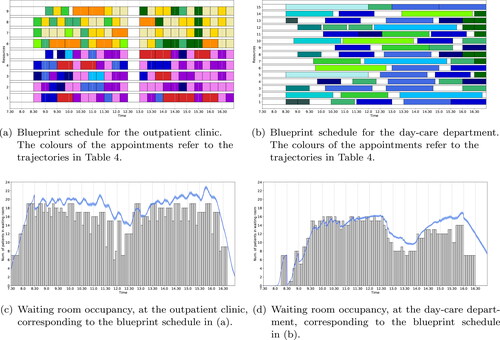
Figure 9. Optimal blueprint schedule of the outpatient clinic (a) and day-care department (b) for the medical oncology & haematology clinic in UMCU with time-dependent restrictions on the number of patients simultaneously allowed in the waiting rooms. The corresponding waiting room occupancy is shown in (c) and (d), resp. We refer to the caption of for a more detailed explanation of the figure.
Table