Figures & data
Figure 1. State-space diagram of transitions between the three regimes for the two different types of strategies. (a) Strategies including lockdowns. (b) Strategies without lockdowns.
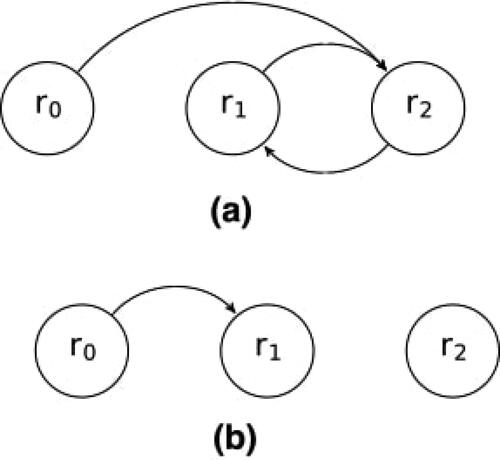
Figure 2. Example of an attribute tree for COVID-19.
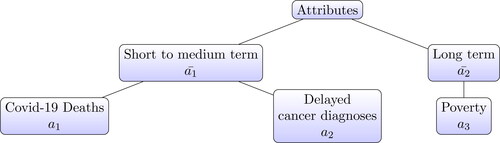
Figure 3. SIRD disease dynamics.
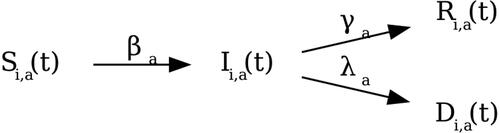
Figure 4. Plots showing how the daily deaths evolve over time for one simulation within the stochastic model. (a) Strategies including lockdowns. (b) Strategies without lockdowns.
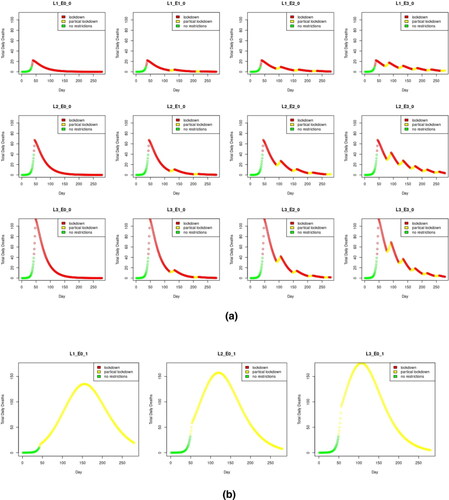
Figure 5. Regional aggregate weighted life-years lost under different attribute weightings for each strategy with age stratification. Top left: COVID-19 deaths only. Top right: COVID-19 and delayed cancer diagnoses deaths equally weighted. Bottom left: COVID-19, delayed cancer diagnoses and poverty deaths equally weighted. Bottom right: COVID-19, delayed cancer diagnoses and poverty deaths custom weighting.
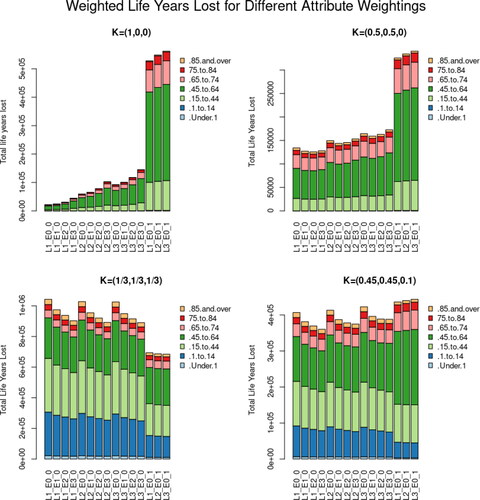
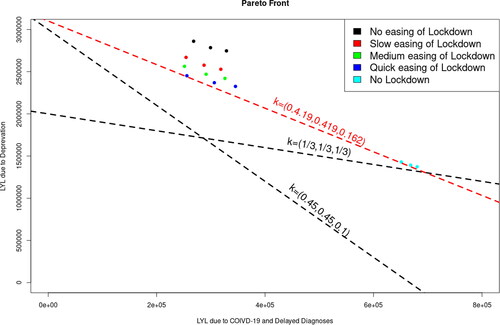
Figure 6. Pareto plots showing the trade-off between life-years lost (LYL) due to poverty (deprivation) on one hand and COVID-19 and delayed cancer diagnoses on the other. The dashed lines represent examples of different attribute weightings with the one in red representing the critical weighting between lockdown and non lockdown strategies.