
Figures & data
Figure 1. Simulation process map. DNA = Did not attend.
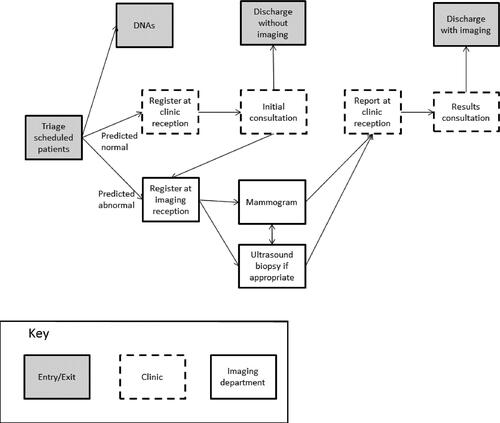
Table 1. Illustrative two-way contingency table of lump (L) and urgency (U).
Table 2. Simple scorecard.
Table 3. Full scorecard.
Table 4. Classification performance of simple scorecard for different cut-off scores.
Table 5. Classification performance of full scorecard for different cut-off scores.
Table 6. Operational performance of simple scorecard for different cut-off scores.
Table 7. Operational performance of full scorecard for different cut-off scores.
Supplemental Material
Download MS Word (27.7 KB)Availability of data and material
The dataset generated and analysed during the current study is not publicly available because this was a condition of patient consent. However, an anonymised version is available from the corresponding author on reasonable request.