
Figures & data
Table 1. Composite indicator values for sustainability dimensions in Finland.
Table 2. Selected desirable properties from (Afsar et al., Citation2021b) with the corresponding research questions.
Table 3. Items to be answered after applying each method.
Table 4. Concluding items after all methods are applied.
Figure 1. The UI for RPM.
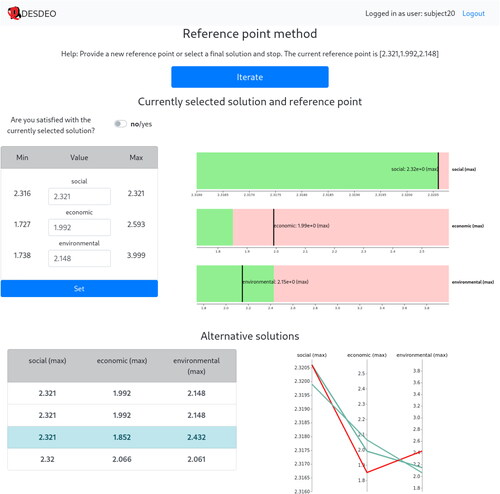
Figure 2. The UI for NIMBUS.
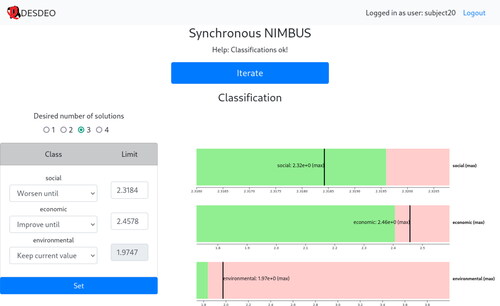
Figure 3. Procedure of the experiment.
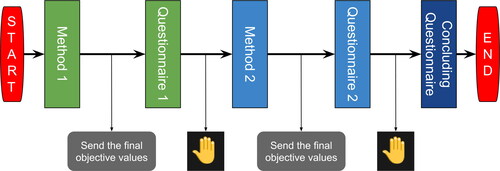
Table 5. Responses as average scores for measuring cognitive load.
Table 6. Responses as average scores for capturing preferences.
Table 7. Responses as average scores for measuring satisfaction.
Table 8. Why did participants stop iterating?.
Table 9. Results of the comparative items asked after completing both methods.
Table 10. Responses as average scores on involvement levels of participants as DMs.