Figures & data
Table 1. Comparison between Vennix (Citation1996) adapted and the New Devil’s Advocate.
Figure 1. Project timeline in which the case study was conducted (adapted from Cappuccio et al., Citation2017).

Table 2. Sample of the role-plot table with the information provided to the facilitators playing the New Devil’s Advocate.
Figure 2. Evaluation framework adopted.
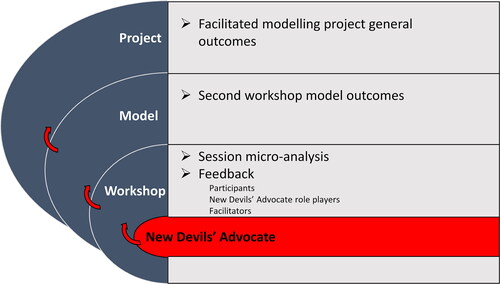
Table 3. New Devil’s advocate coding scheme.
Figure 3. New Devil’s Advocates’ impact on the system map (Stock and Flow Diagram). The initial model’s structure at the beginning of the workshop is depicted in black, additions made during the session are presented in red, and the structure directly suggested by the New Devil’s Advocate performers is shown in blue.
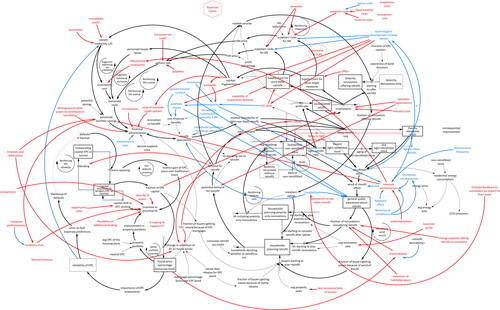
Table 4. Second workshop New Devil’s Advocates’ and participants’ cumulative interventions, variables, and connections.
Table 5. Coding results for the New Devil’s Advocates’ interventions.
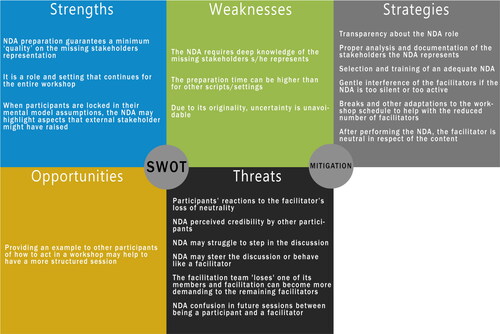
Figure 4. New Devil’s Advocate SWOT and mitigations analysis.