Figures & data
Figure 1. Solution times for the two formulations on 50 random instances with 2 producers, 5 energy sources, 3 nodes, and 3 representative days. If one of the methods failed to find a solution within 3600 s, an orange marker is used, and the marginal distributions on the right and top sides exclude unsolved instances.
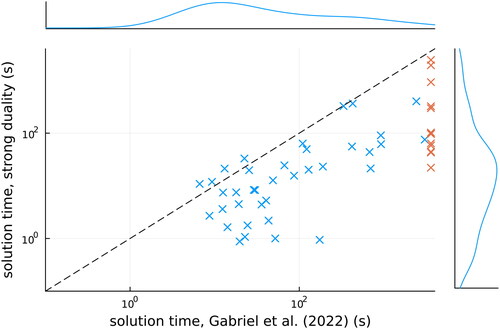
Table 1. Model sizes for the two reformulations.
Figure 2. Cumulative distribution functions of solution times for the two formulations with 1–3 producers, 4–6 energy sources, and 2–4 nodes and representative days. For each problem size, 50 instances are generated and solved.
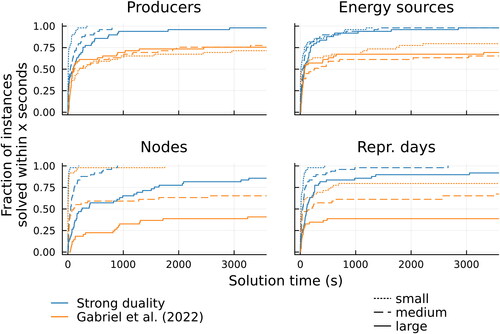
Figure 3. Weighted average electricity production portfolio over the five nodes and three representative days.
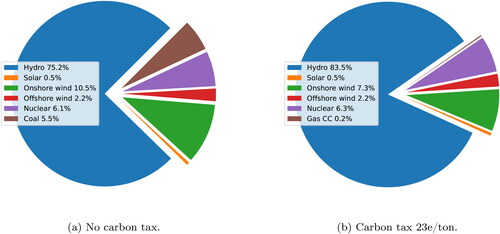
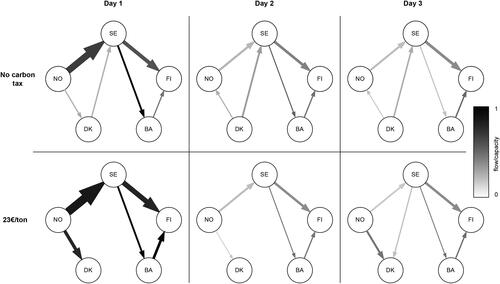
Figure 4. Transmission grid usage with different carbon taxes and representative days. The size of an arrow is proportional to the flow on the line and the colour of an arrow represents congestion: black arrows correspond to lines operating at their limit. The nodes are FI = Finland, SE = Sweden, NO = Norway, DK = Denmark, BA = Baltic countries.