
Figures & data
Figure 1. The process of the lifestyle intervention.
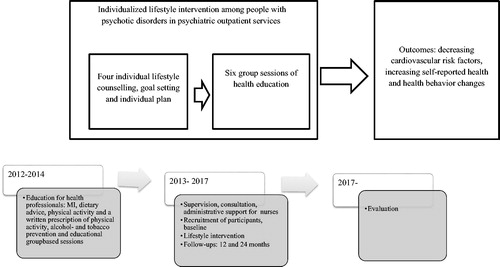
Table 1. The part of the intervention provided for the participants and frequency of utilization (n = 54).
Figure 2. Flow of participants.
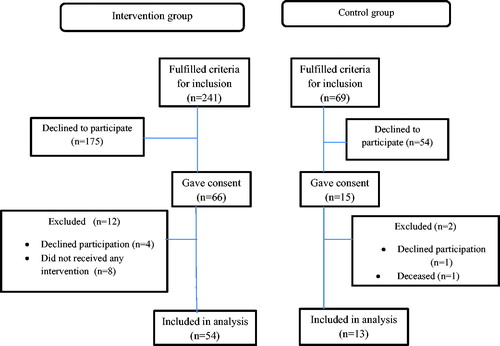
Table 2. The baseline characteristics of the participants in the intervention and control groups.
Table 3. Baseline and follow-up data.
Table 4. Results from the unadjusted multigroup 2-level multilevel analyses of the differences in effects between the intervention and control groups.