Figures & data
Figure 1. The PRISMA 2020 flow diagram showing the study selection process (Page et al., Citation2021).
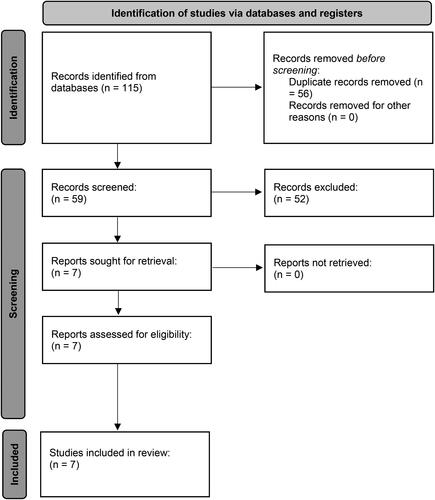
Table 1. Descriptive details of sensory modulation intervention studies and NICE quality scores.
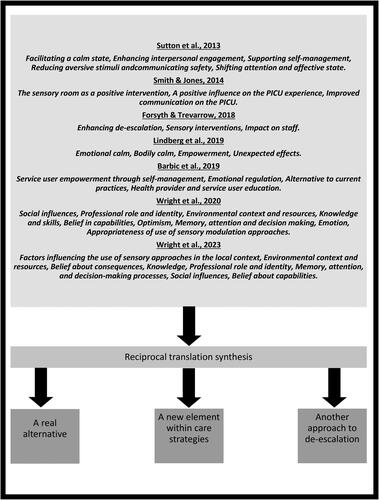
Figure 2. Conceptual map of the reciprocal translation synthesis.