
Figures & data
Figure 1. The series of opgaafrolle, 1787–1842, by district. Fully transcribed censuses in green, partially transcribed ones in yellow, illegible ones in red and the un-transcribed census returns in blue.
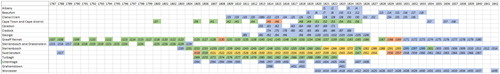
Table 2. Description of variables used in the record comparisons.
Figure 2. Regression coefficients for logistic regression (left panel) and variable importance plot for random forest model (right panel).
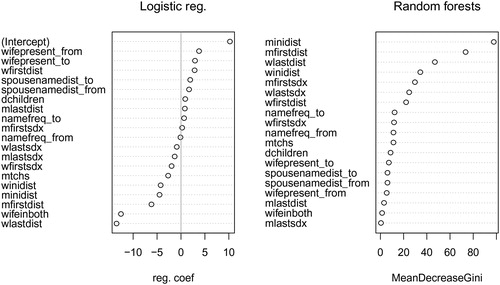
Figure 3. Errors as share of total candidates in the training data as a function of the threshold for logistic regression (left panel) and for random forest (right panel) model. Vertical reference lines at error rate minimizing-vote share and 0.5.
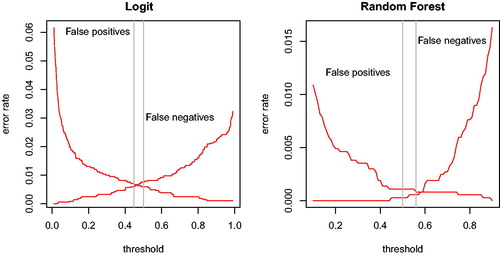
Table 3. Confusion matrix for logit models.
Table 4. Confusion matrix for random forests model.
Figure 4. Share of households linked by year.
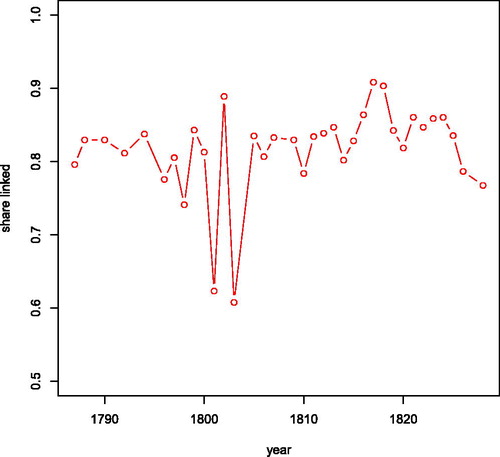
Figure 5. Cumulative links in opgaafrolle panel by series length. Number of series plotted on a (natural) logarithmic axis.
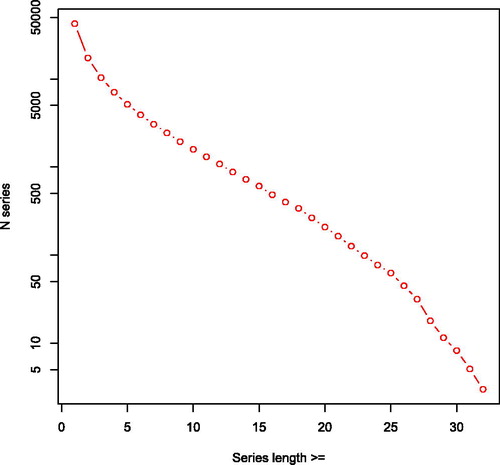
Figure 6. Smoothed scatter plot of the number of children v. the one year lag of number children (left) and of the natural logarithm of the number of cattle v. its one-year lag (right) in panel created through record linkage.
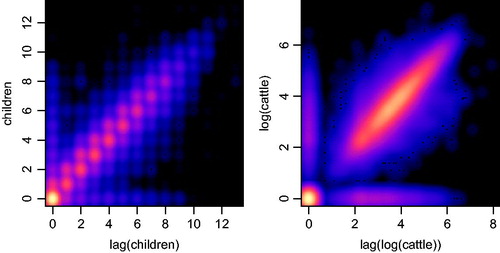
Figure 7. Distribution of natural logarithm of number of cattle by length of series. x refers to the series length.
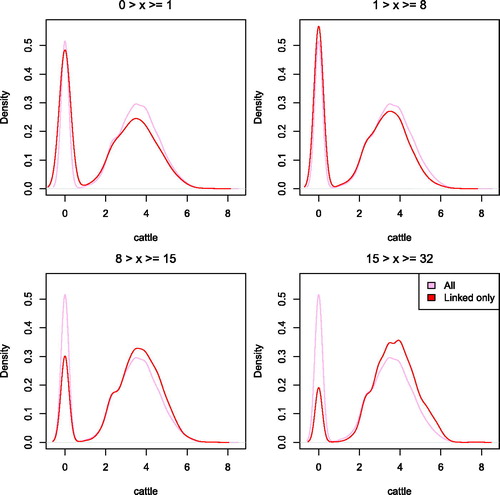
Figure 8. Distribution of uniformised name frequency in the Graaff Reinet district and linkage rate by name frequency. Name frequency is plotted in a logarithmic axis. Distribution computed using kernel density estimation, a nonparametric method to estimate the probability density function. The linkage rate is the share of observations in the opgaafrolle data that was linked to the genealogy dataset.
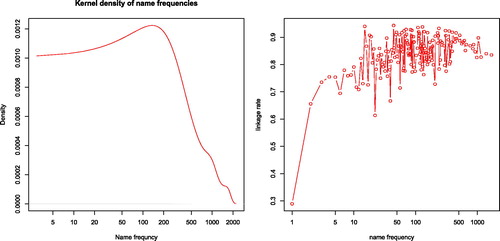
Figure 9. Share of observations in opgaafrolle that is linked to an observation in the genealogy by year.
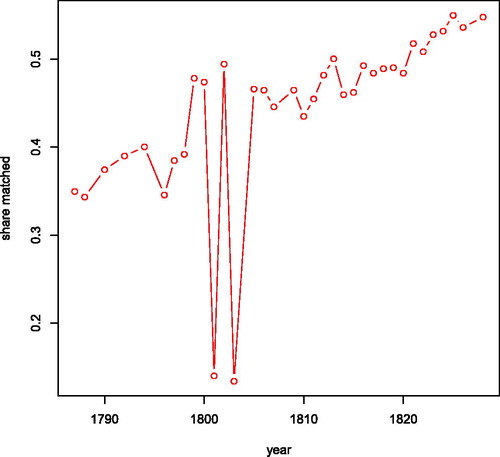
Table 1. Example records from Graaff-Reinet opgaafrolle.
Figure A1. Distribution of between-group linking scores. For each indexed person in the opgaafrolle that was linked to more than one person from the genealogies, the difference of the mean random forest classification score for each genealogy-person was calculated. The maximum possible difference is 0.5.
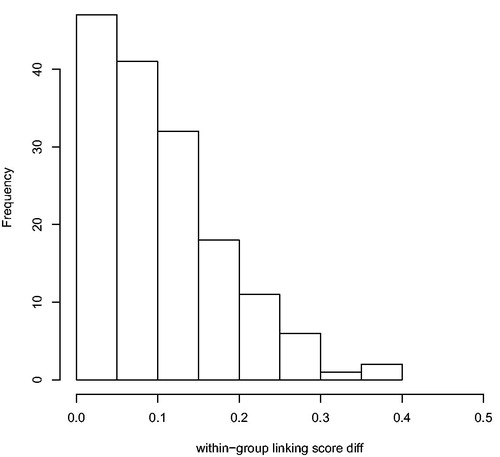
Table A1. Logistical regression predicting record matches.
Table B2. False positives created by random forest classifier.
Table A3. AUC after omitting one variable.
Table A4. AUC after omitting two variables (full model AUC: 0.94).