Figures & data
Table 1. Example co-occurrence matrix.
Figure 1. Continuous bag-of-words and skip-gram architectures (Figure taken from: (Mikolov, Sutskever, et al. Citation2013)).
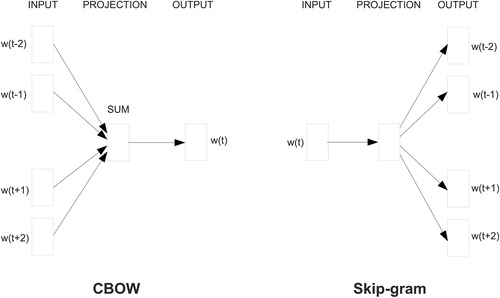
Figure 2. The angle or cosine distance between words along two dimensions (latent factors) indicates how close they are in meaning.
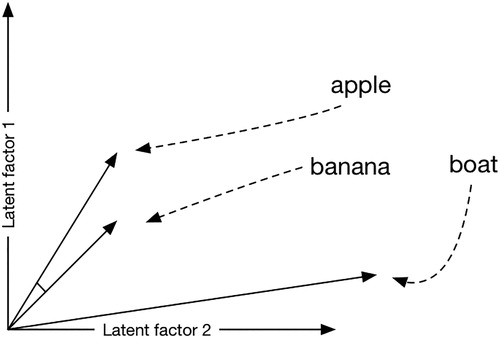
Figure 3. Two-dimensional projection of vectors of countries and their capital cities. (Figure taken from: (Mikolov, Sutskever, et al. Citation2013).
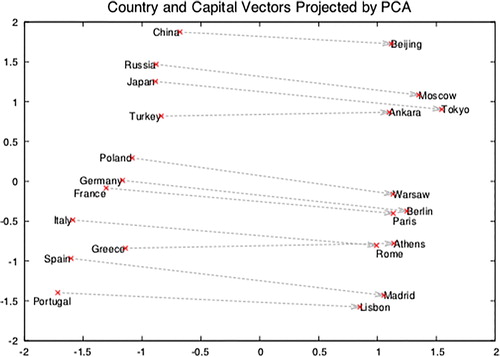
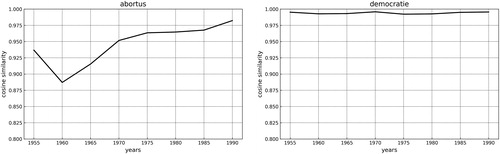
Figure 4. Semantic Shifts of Individual Words in Dutch Newspapers (dashed line indicates the frequency and the solid line refers to cosine similarity.
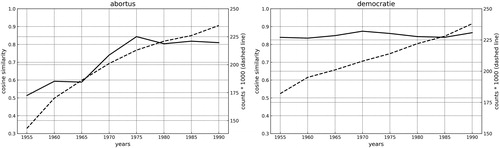
Figure 5. Nearest neighbors to “abortion” in 1950-1954, 1975-1979, and 1990-1994.
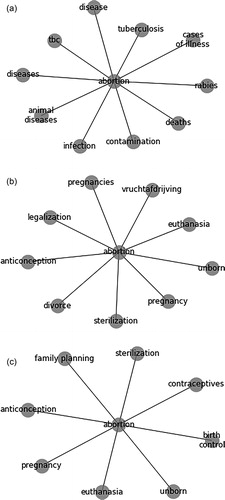
Figure 6. Changes in local neighbors (k = 25) of two target words in embeddings trained on historical Dutch Newspapers.