Figures & data
Figure 1. The study area. Source: The Authors.
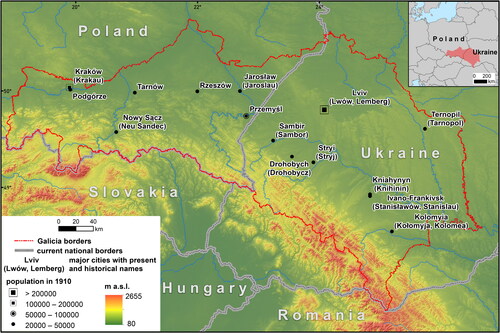
Figure 2. Workflow for the production of the dataset. Source: The Authors.
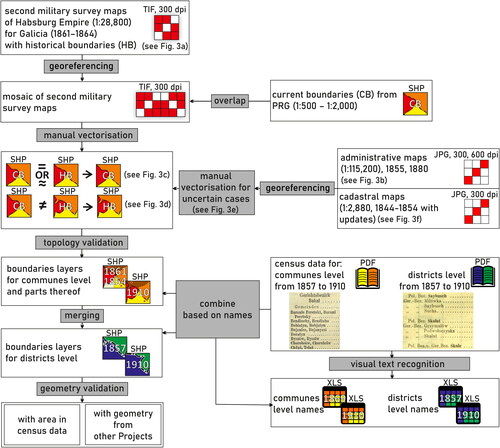
Figure 3. Examples of administrative boundary vectorization based on archival maps. (a) Second military survey map (1:28,800) with cadastral commune boundaries, CmC; (b) administrative map (1:115,200) with cadastral commune boundaries, CmC; (c) boundaries with no changes; (d) change connected to urban expansion; (e) no boundary symbol in the riverbed; (f) explanation of the lack of a boundary symbol in the riverbed based on a cadastral map (1:2880) due to disputed area between the communes. Source: The Authors.
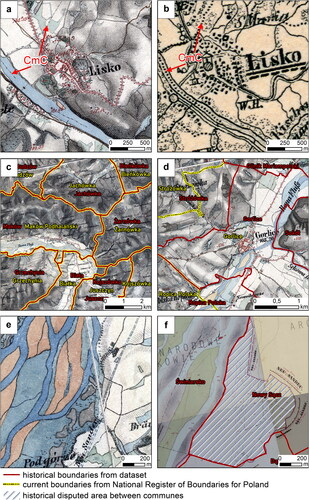
Table 1. Summary of the numbers of reconstructed administrative units and parts thereof for census years and second military survey years.
Table 2. Names of layers in the dataset.
Table 3. List of attributes covered by the dataset.
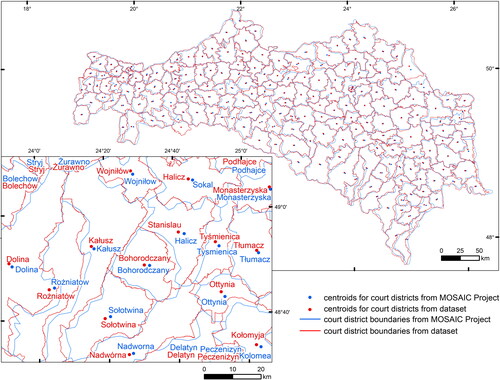
Figure 4. Comparison of centroid positions for court districts from the Mosaic Project and from the dataset. Source: The Authors.