
Figures & data
Figure 1. Data collection and modelling workflow. An illustration of how textual features in Peter’s source text are collected as CASTEMO statement data, then analyzed for crime and social content for the data projection. The example CASTEMO statement has been presented in simplified form, with only the pertinent action, actants and their modifiers (“frequency” property applied to action; “social category” property applied to direct object actant).
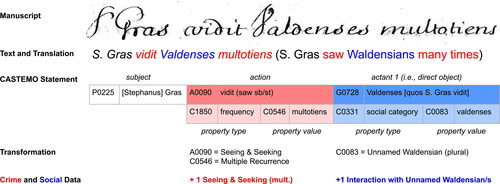
Table 1. Pilgrimage weight scale.
Table 2. Primary penances – pilgrimages.
Table 3. Primary penances – crosses.
Table 4. Primary penances – Constantinople.
Table 5. Intensifying penances – crosses (alongside beyond-local pilgrimage).
Table 6. Intensifying penances - maintenance fines (alongside any primary penance).
Table 7. QCA conditions and their derivation from the general data projection.
Table 8. QCA necessity tests (first analyses including all crime conditions, n = 620).
Table 9. QCA truth table (second analyses) – Constantinople (n = 620).
Table 10. QCA truth table (second analyses) - beyond-local pilgrimage with crosses (n = 620).
Table 11. QCA truth table (second analyses) - beyond-local pilgrimage without crosses (n = 620).
Table 12. QCA necessity test and truth-table analysis - Constantinople (second analyses, n = 620).
Table 13. QCA necessity test and truth-table analysis - beyond-local pilgrimage with crosses (second analyses, n = 620).
Table 14. QCA necessity test and truth-table analysis - beyond-local pilgrimage without crosses (second analyses, n = 620).
Table 15. Descriptive statistics (n = 620) of numerical crime variables.
Table 16. Descriptive statistics (n = 620) of categorical variables.
Table 17. Multiple regression model result (n = 620) for the dependent variable of combined penance Index (CPI), R2=0.570, F(df regression = 24, df residual = 595) = 94.444, p < 0.001, AIC = 1073, BIC = 1180.
Supplemental Material
Download MS Excel (13.8 KB)Supplemental Material
Download MS Excel (13.5 KB)Supplemental Material
Download MS Excel (12.3 KB)Supplemental Material
Download MS Excel (591.9 KB)Data availability statement
The authors confirm that the data supporting the findings of this study are available in its supplementary materials.