
Figures & data
Table 1. Processing steps and factors to convert different reported units of the products traded into metric tons and the sources reporting the original figures for the United States between 1870 and 2017.
Table 2. Classification of aggregated wood product categories used in this analysis and corresponding products reported in original sources, and respective FAO categories and products.
Table 3. Average U.S. imports and exports by main trade partners (countries and world regions) as fractions of total timber products traded for three periods, 1871–1905, 1965–1996, 1997–2017.
Figure 1. Physical imports and exports of timber products of the United States, 1870–2017. Combined timelines. For sources, products considered, and conversion methodology see and text. Data in million metric tons per year. Physical exports are displayed as negative flows.
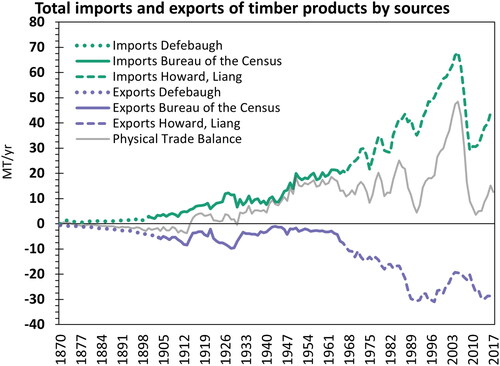
Figure 2. Physical trade balance (PTB) of the main timber product categories traded in the United States, 1870–2017. From 1905 to 1950, data on raw materials and finished products are not accessible or aggregated in the primary products (e.g., paper and cardboard are listed with wood-pulp products, i.e., in the Pp category). Negative values indicate net exports, positive values net imports. Data in million metric tons per year.
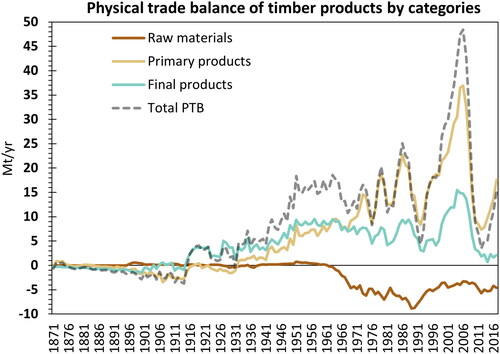
Table 4. Forest transition indicators, based on Magerl et al. (Citation2019), Magerl et al. (Citation2022) and their connection to international trade of wood in the United States – area (mha = Mega hectar = million hectar), biomass stocks (GtC = gigatons carbon = one billion tons carbon), harvest, and trade (Mt/yr = megatons per year) for the three periods discussed (1870–1914, 1915–1960, 1961–2017) in absolute numbers (left panel) for selected time points and compound average annual growth rates for the three periods (right panel).
Table A1. Conversion from imperial to metric units by original source.
Table A2. Conversion of wood products from volume to weight by wood type.