
Figures & data
Table A1. CCC-HISCO, HISCAM-U2, and HISCAM-GB indices by HISCO.
Figure 1. Son occupational rank by father rank, CCC scores, marriages 1837–1879.
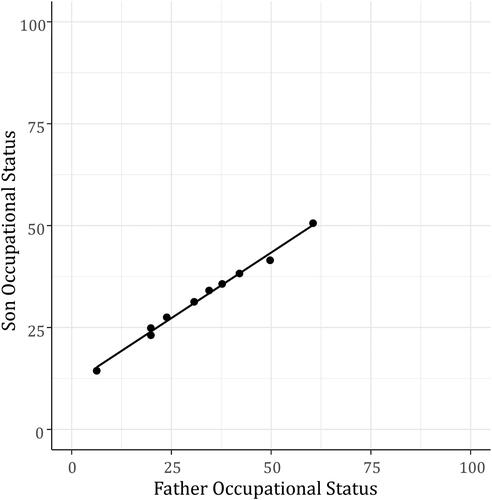
Figure 2. The distribution of occupational status, CCC and CCC2 scores. Note: Each occupation is weighted equally, not by number of observations.
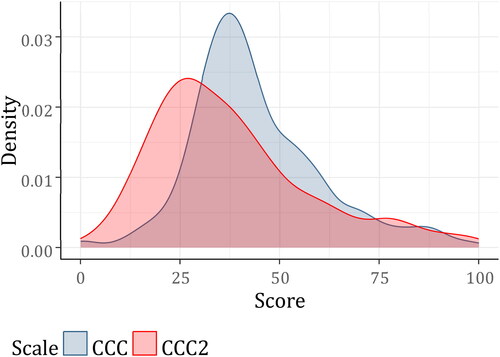
Figure 3. Comparison of CCC and CCC2 scores. Note: The 10 occupations with the highest sum of square deviation between the scores are highlighted.
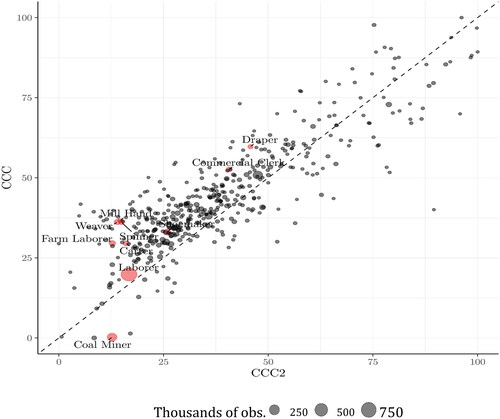
Figure 4. Comparison of HISCAM-GB and CCC-HISCO scores. Note: The ten occupations with the highest sum of square deviation between the scores are highlighted.
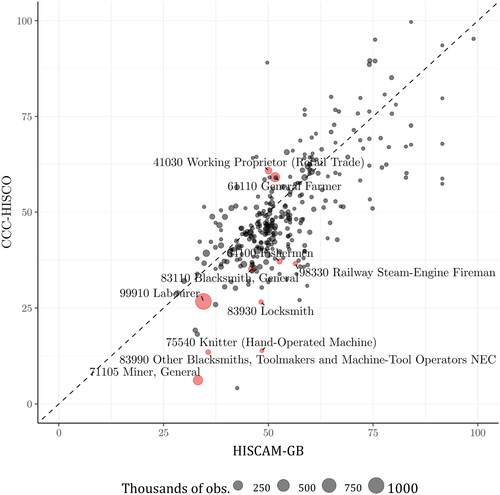
Figure 5. Comparison of HISCAM-U2 and CCC-HISCO scores. Note: The ten occupations with the highest sum of square deviation between the scores are highlighted.
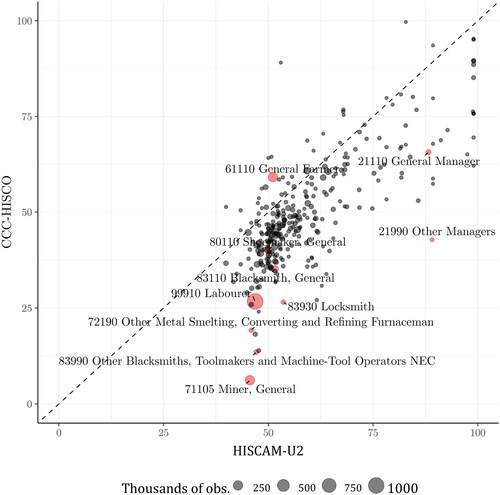
Table A2. The CCC and CCC2 indices and components.
Table 1. Father-son occupational pairings, 1837–1879.
Table 2. Parish register marriage data, 1837–2021.
Table 3. FOE social status data, males.
Table 4. Correlations between the components of the CCC2 index.
Table 5. Top and bottom 10 occupations by CCC2 score.
Table 6. Top and bottom 10 ranked occupations by CCC score.
Table 7. Estimating potential biases in the CCC index, marriage sample, 1837–1939.
Table 8. Correlation between occupational status indices, 1800–1939.
Table 9. Intergenerational correlations in marriage database, 1837–1939, males.
Table 10. Father-son correlation of occupation rank (CCC), by location, 1837–1939.