
Figures & data
Table 1 Women.
Table 2 Men.
Fig. 1 Generalized Pareto Q–Q plots for women and men for the year 2015.
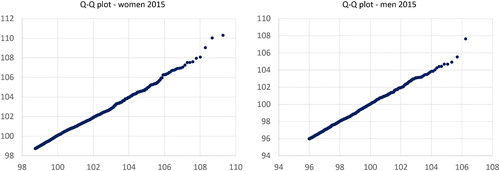
Fig. 2 Estimated extreme values indices for the years of death .
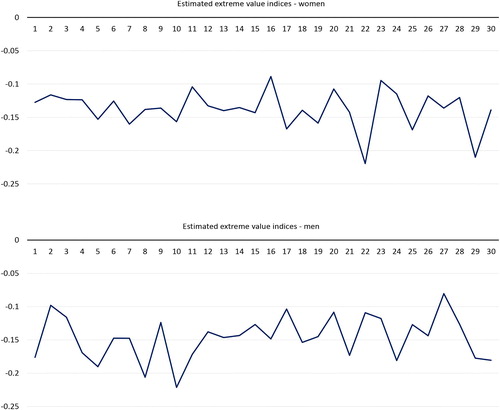
Fig. 3 Estimated maximum human life span for the years of death .
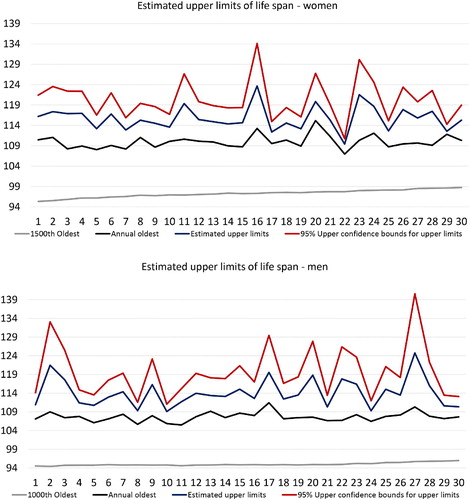
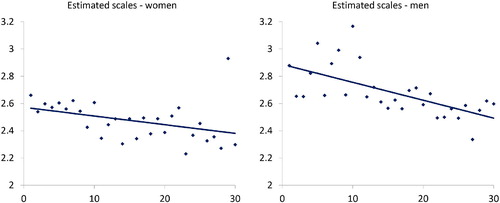
Fig. 4 Estimated scale shows downward trend over the 30 years.
Supplemental material