Figures & data
Fig. 1 Directed acyclic graph for Bayesian evidence synthesis.
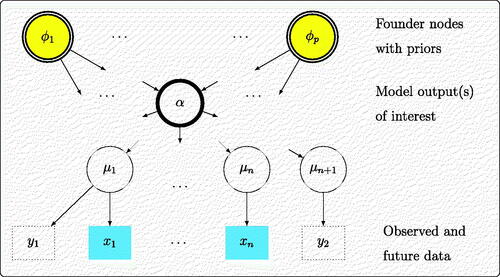
Fig. 2 Graph representing a known deterministic model.
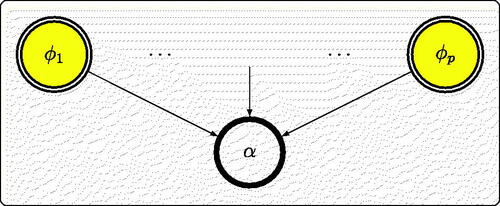
Fig. 3 Directed acyclic graph for HIV prevalence estimation model.
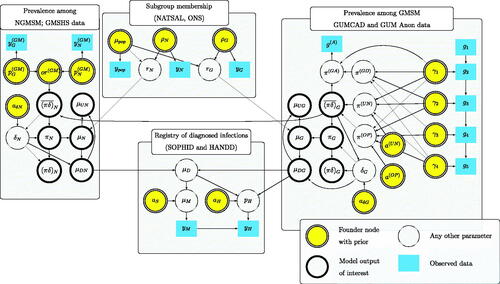
Fig. 4 Posterior distributions of HIV prevalence (top) and numbers of MSM living with HIV/AIDS (bottom), London 2012. Darkness within each strip proportional to posterior density, with 95% credible intervals indicated.
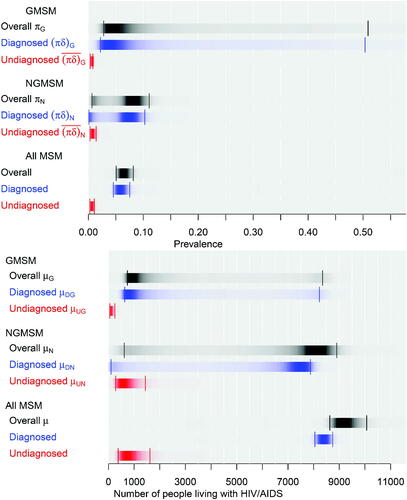
Fig. 5 Expected value of partial perfect information in the HIV prevalence model.
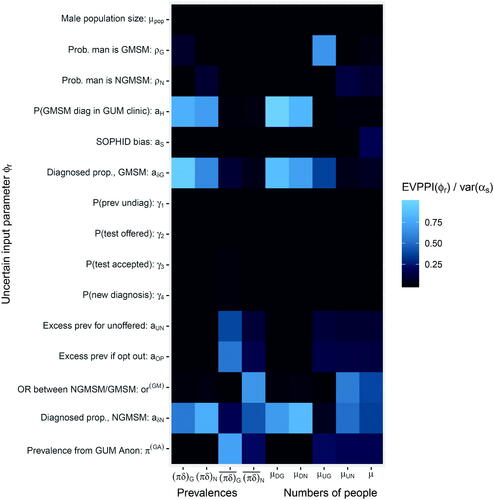
Fig. 6 EVSI: value of additional data from GUM Anon or GMSHS for reducing the variance of the total number of MSM with undiagnosed HIV, . The x-axis is on the log scale. The y-axis is the variance, with the labels as SD2.
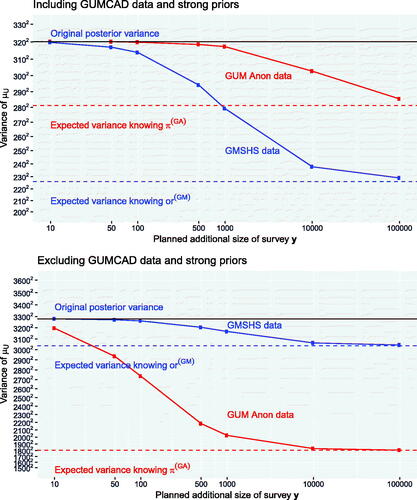
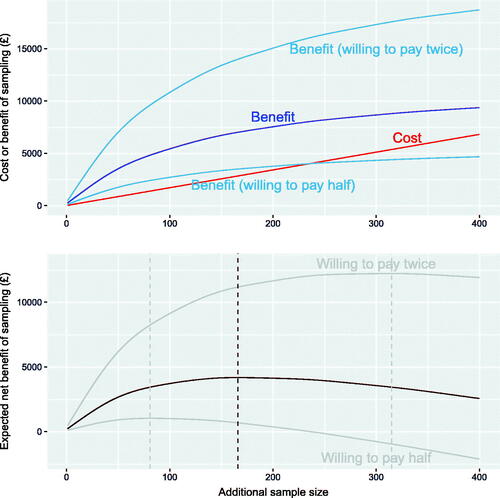
Fig. 7 Expected cost, benefit, and net benefit of sampling up to 400 extra participants from GUM Anon, if we wish to reduce the variance of μU , the number of MSM with undiagnosed HIV. The optimal sample size is illustrated as a dotted line.