Figures & data
Fig. 1 Left panel: representation of fiber count matrix (F) for subject 6. Middle panel: Euclidean distance among ROIs matrix (D), equal for all subjects. Right panel: spatial matrix (W) for subject 6 given as a weighted combination of F and D.
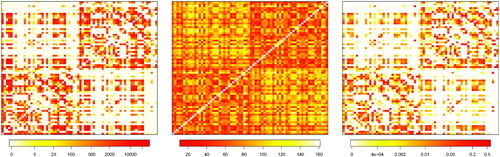
Fig. 2 Estimates of vector for subject 6 (left panel) and subject 13 (right panel).
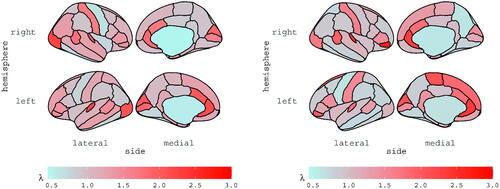
Fig. 3 Estimates of vector for subject 6 (left panel) and subject 13 (right panel).
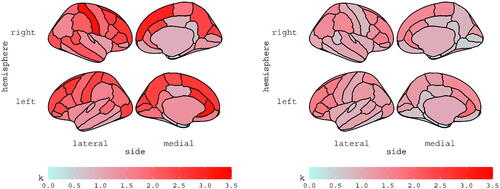
Table 1 Estimates of the scalar static parameters of the model for all subjects. Asymptotic standard errors are reported in brackets.
Fig. 4 Left panel: R-fMRI times series and spontaneous activations (dots) detected in ROI lh-parahippocampal (left hemisphere, parahippocampal). Right panel: corresponding residuals and outliers (dots). Top panels: subject 6. Bottom panels: subject 13.
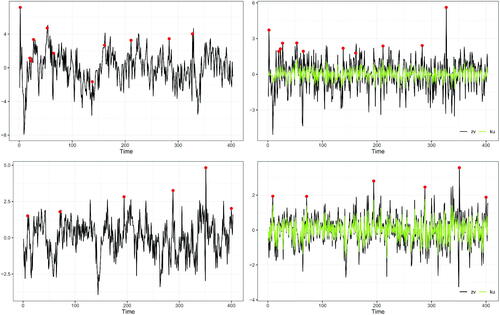
Fig. 5 Spontaneous activations detected for subject 6 (top) and 13 (bottom) over time (x-axis) for all ROIs (y-axis); above the black line we record the ROI in the right hemisphere, while below the black line we record the ROIs in the left hemisphere.
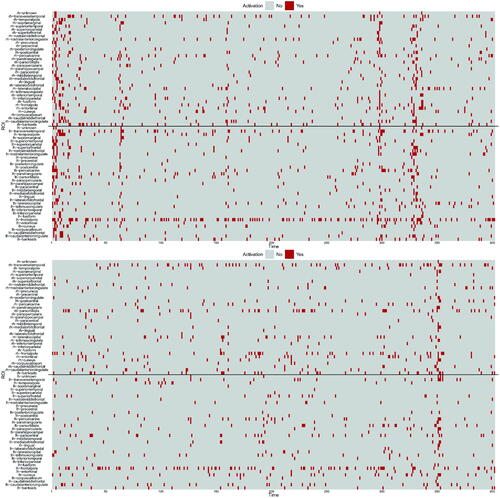
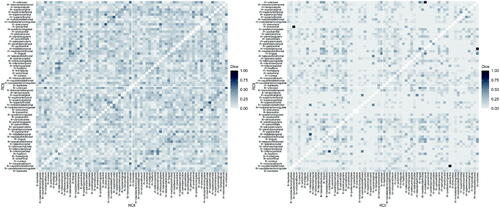
Fig. 6 Dice similarity index computed across activations recorded over time for subject 6 (left panel) and subject 13 (right panel).